What the Research Says About User Preferences and Perceptions for In App Advertising
Friday, March 27, 2015

|
Stuart Parkerson |
There are infographics and there are knockout infographics. While the use of infographics has grown in the last couple of years as a way to visually provide a large amount of information in a small area, when viewed on a smartphone most infographics produce text so small that it’s just impossible to get anything constructive out of it.
Not so with a new interactive infographic recently published by Localytics and Pollfish. And the bonus for app developers is that its represents the results from a poll conducted from more than 5,000 app users to learn their perceptions and preferences when viewing in-app advertising.
The infographic provides well defined bite sized sections that you can enhance to view that specific nugget of information. No more endlessly scrolling down the infographic to try to keep up with the topic. And there is a wealth of information provided gleaned directly from the research study.
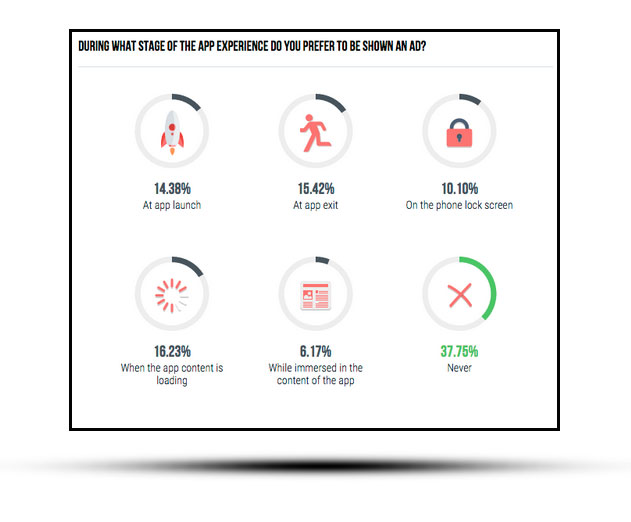
For example, 37% of respondents prefer to never have to view an ad. We know that with the current monetization models used by the majority of independent app publishers, this is just not an option. However, knowing that one third of your users do not want to be shown ads offers up a number of insights - including the fact that over two thirds of users are ok with viewing an ad.
What else did the study show? 48% of app users prefer full screen or pop-up ads, while 51% prefer small banner ads visible all the time. This even split demonstrates that you can’t have a one size fits all ad solution, you need to diversity your ad options.
Another nugget? In a blog post that Localytics has published to present the findings is provided this insight: “From the survey we see that the 38% of respondents would rather not receive push or in-app notifications but that this depends entirely on the app, and has the capacity to change when it’s an app they truly enjoy interacting with and gain value from. People prefer to receive messages that pertain to their unique app usage. Knowing your users and their likes and dislikes allows for higher customer satisfaction and more frequent app engagement. It’s smart marketing.”
One really sweet aspect of the infographic is the ability for you to sort the information by demographic including gender, age, geo, and operating system. You can learn more about the study findings and to view the infographic here.
Read more: http://info.localytics.com/blog

Become a subscriber of App Developer Magazine for just $5.99 a month and take advantage of all these perks.
MEMBERS GET ACCESS TO
- - Exclusive content from leaders in the industry
- - Q&A articles from industry leaders
- - Tips and tricks from the most successful developers weekly
- - Monthly issues, including all 90+ back-issues since 2012
- - Event discounts and early-bird signups
- - Gain insight from top achievers in the app store
- - Learn what tools to use, what SDK's to use, and more
Subscribe here

_r2f0ox12.jpg&width=800)


