Key insights into app performance and competition from Adjust
Wednesday, December 5, 2018

|
Richard Harris |
Find out how your mobile marketing measures up by using the new Global Benchmarks 2.0 tool from Adjust. Gain insight into how much it typically costs to acquire a user, average CTRs, cost per clicks, and more.
Adjust recently launched the second iteration of its Global Benchmarks tool - offering an overview of the mobile marketing landscape and bringing more transparency to the industry.
Based on the company’s aggregated database, Adjust’s Global Benchmarks 2.0 analyzes data from over 7,000 apps and billions of installs. It allows mobile marketers to see the latest data on app performance, from average CPI to the prevalence of various fraud types. From here, users can compare and optimize their app’s performance and create custom reports, free of charge.
Mobile marketers can use Adjust’s Global Benchmarks 2.0 to better understand how their own data measures up against industry averages. By comparing billions of installs to your own KPIs, these industry trends and benchmark averages will provide insight into your app’s current performance.
Commenting on the update, Adjust’s Co-founder and CEO, Christian Henschel, said: “All mobile marketers want to improve their apps’ performance, but finding the right data to inform marketing decisions can be a time-consuming and costly process. Adjust’s Global Benchmarks 2.0 provides the insights needed to make smart, data-driven decisions. After receiving great feedback from the industry on the launch, we’re very pleased to share expanded metrics and fresh new data with this second version”.
The tool is also the first of its kind to make specific KPIs, such as session data, publicly available. Marketers can create tailored reports without the cost of expensive third-party benchmark reports, which may not be adequately tailored to their needs.
What’s included in the Global Benchmarks 2.0?
With fresh data from Q2 and Q3 of 2018, the tool includes five new metrics - Click Through Rate (CTR), Conversion Rate from Click to Install, Cost per Mille (CPM), Cost per Click (CPC), and Distribution of Fraud Types.
The benchmarks also show industry standards for Retention Rates, Cost per Install (CPI), Sessions per User and Rates of Fraudulent Installs. Users can then view this data by quarter, vertical, acquisition type (organic versus paid), platform (iOS versus Android), and region - including Europe, Asia & Pacific, North America, Latin America, and Africa & the Middle East.
As fraud rates continue to rise, Click Injection now accounts for almost half of all mobile fraud
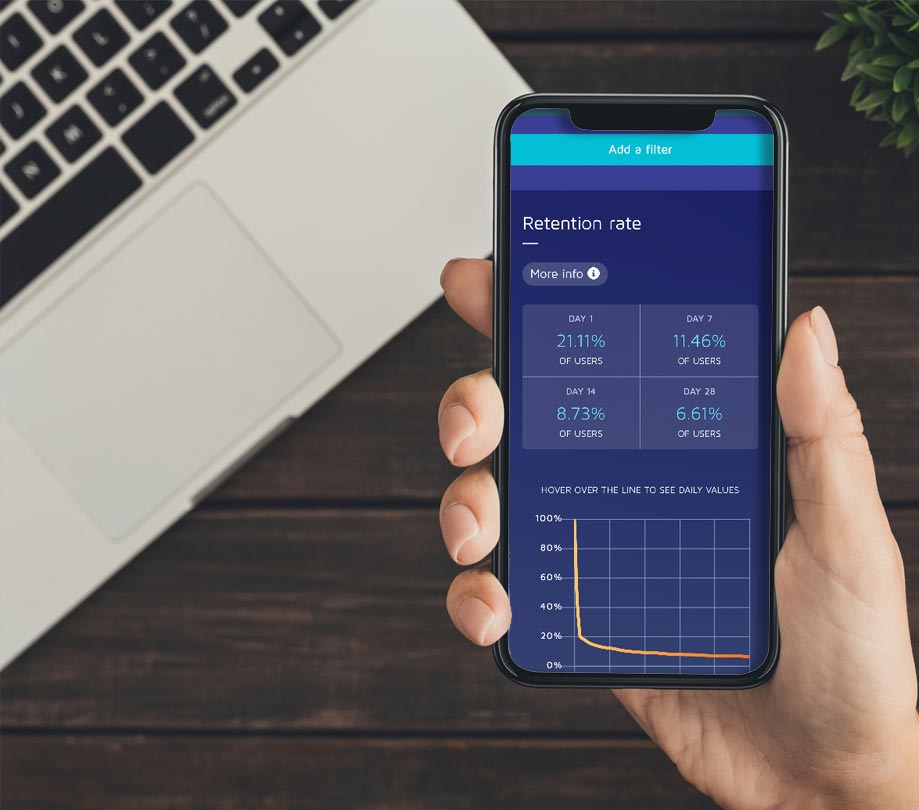
According to the updated tool, retention rates have continued to drop. A day after installing, more than three-quarters (79%) of users won’t reopen an app, and that figure increases to 89% one week later. This data highlights the importance of creating a positive user onboarding experience.
The tool also shows the distribution of various fraud types, shining a light on fraudsters’ preferred methods. Figures show an overall rise in fraudulent activity and a particular increase in Click Injection. This method now accounts for almost half (47%) of all rejected attributions, followed by SDK Spoofing and Click Spam (24% respectively), and Fake Users coming in at 6%.
Adjust’s Global Benchmarks 2.0 forms part of the company’s wider mission to bring education and transparency to the mobile marketing ecosystem, through resources such as their ebooks, a mobile marketing glossary, and a frequently updated blog. The tool is updated each quarter, keeping mobile marketers informed on the industry’s latest benchmarks.
For more insights, and to see how your mobile marketing measures up, explore Adjust’s Global Benchmarks 2.0 here.

Become a subscriber of App Developer Magazine for just $5.99 a month and take advantage of all these perks.
MEMBERS GET ACCESS TO
- - Exclusive content from leaders in the industry
- - Q&A articles from industry leaders
- - Tips and tricks from the most successful developers weekly
- - Monthly issues, including all 90+ back-issues since 2012
- - Event discounts and early-bird signups
- - Gain insight from top achievers in the app store
- - Learn what tools to use, what SDK's to use, and more
Subscribe here

_r2f0ox12.jpg&width=800)


