Facebook Ads Benchmark Report findings for Q2
Friday, July 29, 2022

|
Richard Harris |
Tinuiti has revealed a new report, the Triolpoly series: Facebook Ads Benchmark Report with insights on TikTok, Pinterest, and Snapchat as well. They covered everything you need to know about Facebook and Instagram growth, the iOs 14.5 fallout, the other platforms, and the devices and placements.
Tinuiti has announced that they have finished producing its latest Facebook Benchmark Report, uncovering numerous opportunities for brands to optimize their marketing strategies. While ad impression growth turned positive on Facebook in the second quarter, declines grew steeper on Instagram, where advertisers saw a 27% decrease in Q2 compared to a 4% decline in the first quarter of the year.
Facebook Ads Benchmark Report key findings summary
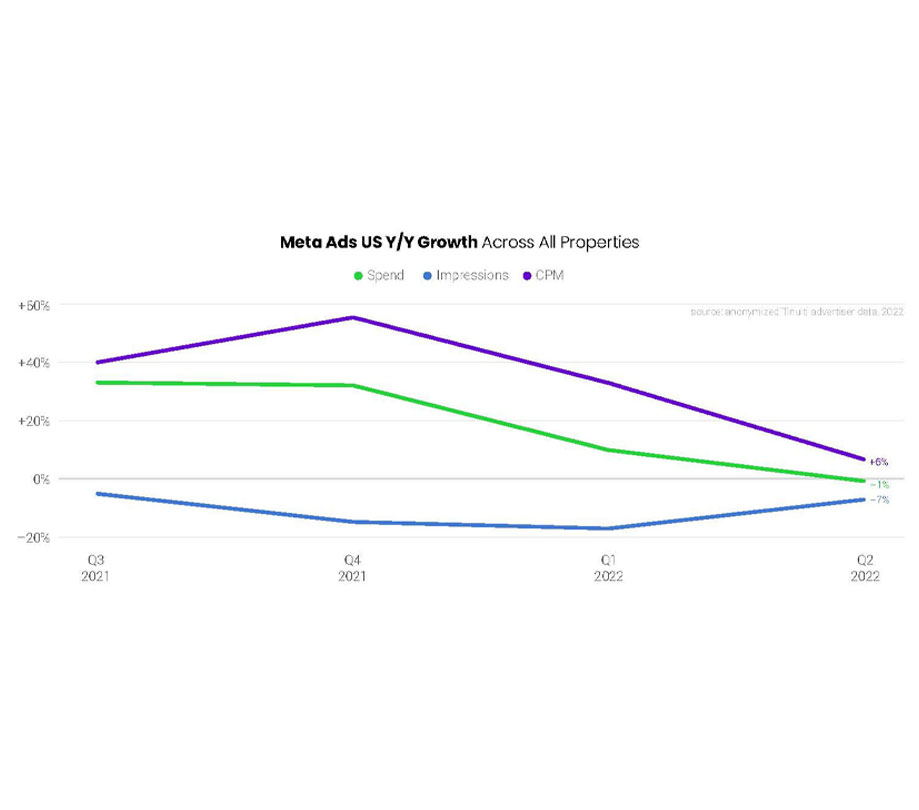
In Q2 2022, advertising spend on Meta properties declined year over year for the first time among Tinuiti advertisers, slipping 1% from a year prior compared to 10% growth in Q1. Impressions declined 7% year over year, an improvement from a 17% decline in Q1, but CPM growth slowed significantly as advertisers ran up against much tougher year-ago comparisons in the second quarter of the year.
On Facebook proper, impressions rose for the first time in the last five quarters, increasing 4% year over year. In aggregate, CPM held steady year over year on Facebook in Q2, though the median advertiser still saw 9% growth. Spend growth slipped to 4% year over year, the slowest growth since Q4 2019 for Tinuiti advertisers on Meta’s flagship app.

Ad impression growth on Facebook
While ad impression growth turned positive on Facebook in the second quarter, declines grew steeper on Instagram, where advertisers saw a 27% decrease in Q2 compared to a 4% decline in the first quarter of the year. Instagram spending fell 10% year over year, and Q2 2022 marked the first quarter on record that Facebook spending grew faster than Instagram for Tinuiti advertisers. Year-over-year CPM growth remained relatively high on Instagram at 22%, but that was the slowest growth of the last six quarters.
One factor seemingly weighing on impression growth for Instagram ads is the rise of Reels, a vertical video format very similar to the look of TikTok videos. During its Q1 earnings call, Meta noted that Reels accounted for more than 20% of all Instagram use. But while Reels ad impression share has grown over the last couple of quarters, it remained below 5% of total Instagram ad impressions in Q2 2022. Looking forward, Instagram impression growth should start to recover as the disparity between Reels ad impression share and Instagram use share narrows.

CPM growth on Facebook and Instagram
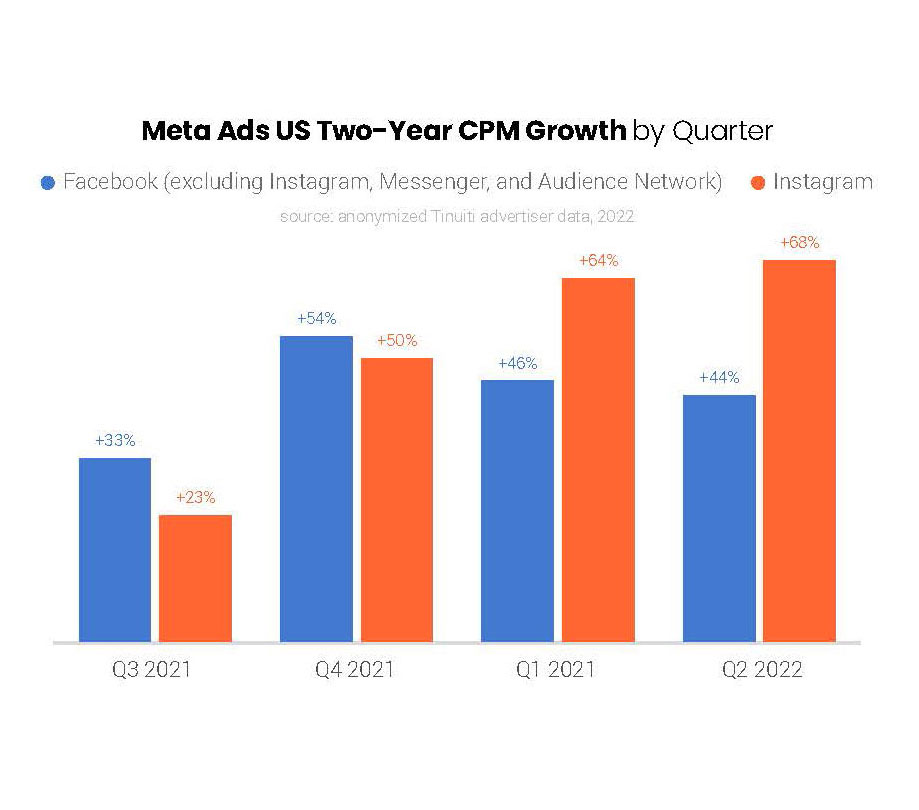
While CPM growth slowed meaningfully on both Instagram and Facebook year over year, ad pricing for these two properties remains well above where it was two years ago for the vast majority of advertisers. In Q2 2022, CPM for Facebook ad impressions was 44% higher than it was in Q2 2020, while CPM for Instagram ads was 68% higher.
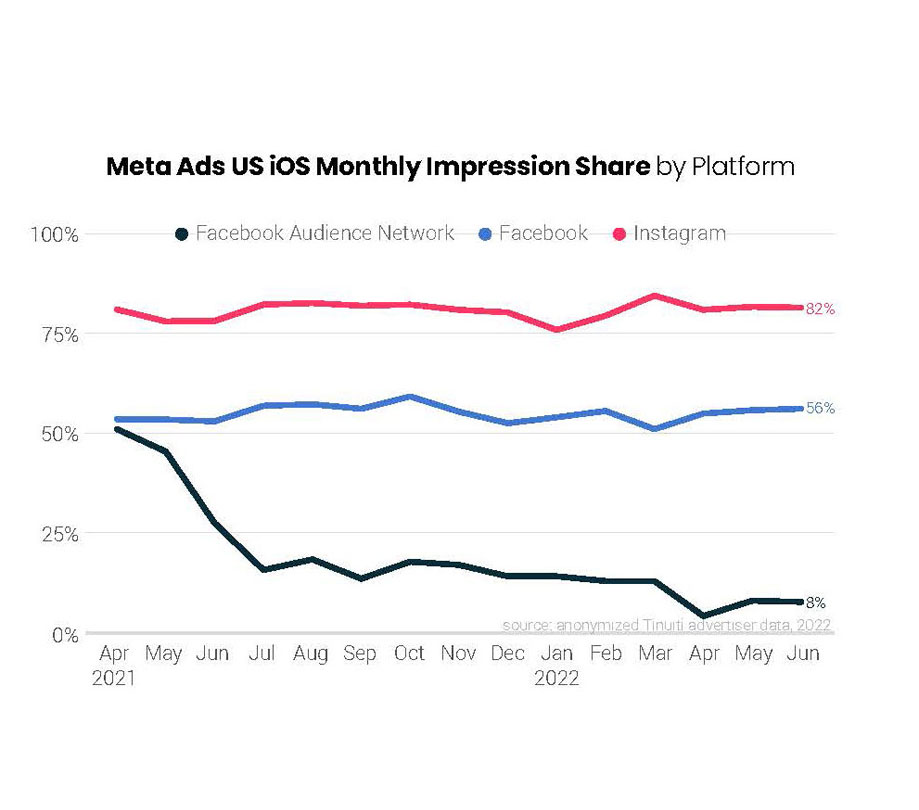
The impact of Apple’s App Tracking Transparency (ATT) prompt continues to be seen in several advertising trends. For example, Android smartphone CPM across Meta properties continues to outpace that of iPhones for the vast majority of advertisers. However, the gap grew much smaller in Q2, narrowing from 46% higher in Q1 to just 12% higher in Q2. This is the smallest gap observed since Q2 2021 when the prompt was originally rolled out.
iPhone spending growth for Meta ads returned to positive territory in June after five straight months of year-over-year declines to start 2022, with ad investment on iPhones up 3% in the final month of Q2. This was nearly identical to the 4% spend growth observed for Android smartphones in June, as advertisers have now lapped the point at which most iOS users upgraded to a version that required the ATT prompt. The gap in year-over-year growth between these two devices was largest in December 2021, when Android smartphone spend rose 101% and iPhone spend rose just 3%.

The impact of Apple's ATT on iOS impressions
ATT also caused issues with Meta’s in-platform reporting, as it became more difficult to track actions taken after seeing or clicking on ads for those users who opted out of tracking. In Q2 2022, Meta’s platform showed both purchases and purchase value down at least 24% year over year for both 7-day and 1-day click attribution windows. Advertisers must increasingly turn to tests and other measurement techniques in order to judge the effectiveness of ad campaigns.
Social advertisers continue to rapidly expand their efforts on TikTok to grow the incremental reach of their marketing campaigns and stay in front of younger users. This has led to a surge in competition in TikTok ad auctions, and CPM climbed 143% for the median Tinuiti advertiser from January 2022 to June 2022.
Even still, most TikTok advertisers continue to find that CPM on the platform is much lower than that of Meta Ads. In Q2 2022, the median advertiser found TikTok CPM 25% lower than Meta Ads CPM, a smaller gap than the 39% difference observed in Q1.

Become a subscriber of App Developer Magazine for just $5.99 a month and take advantage of all these perks.
MEMBERS GET ACCESS TO
- - Exclusive content from leaders in the industry
- - Q&A articles from industry leaders
- - Tips and tricks from the most successful developers weekly
- - Monthly issues, including all 90+ back-issues since 2012
- - Event discounts and early-bird signups
- - Gain insight from top achievers in the app store
- - Learn what tools to use, what SDK's to use, and more
Subscribe here

_r2f0ox12.jpg&width=800)


