Infragistics upgrades embedded data analytics software
Monday, April 6, 2020

|
Brittany Hainzinger |
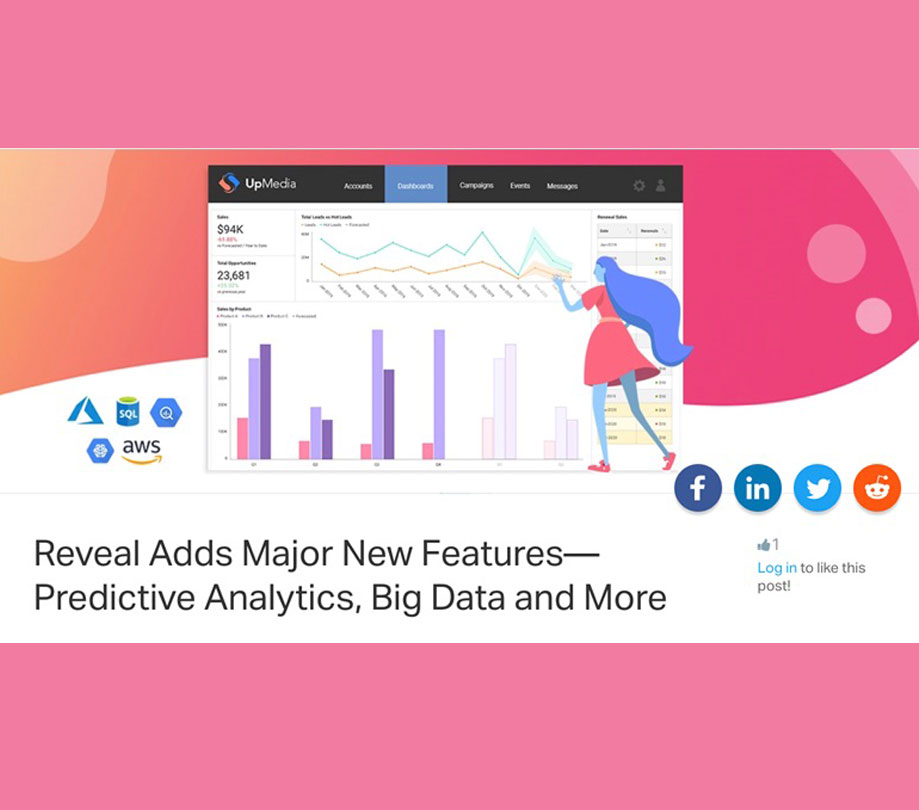
Infragistics announced updates to its embedded data analytics software. Reveal’s newest features address the latest trends in data analytics: predictive and advanced analytics, machine learning, R and Python scripting, big data connectors, and much more.
Infragistics is excited to announce a major upgrade to its embedded data analytics software, Reveal. In addition to its fast, easy integration into any platform or deployment option, Reveal’s newest features address the latest trends in data analytics: predictive and advanced analytics, machine learning, R and Python scripting, big data connectors, and much more. These enhancements allow businesses to quickly analyze and gain insights from internal and external data to sharpen decision-making.
Some of these advanced functions include:
Outliers Detection—Easily detect points in your data that are anomalies and differ from much of the data set.
Time Series Forecasting—Reveal will make visual predictions based on historical data and trends, useful in applications such as sales and revenue forecasting, inventory management, and others. (see attached image below).
Linear Regression—Reveal finds the relationship between two variables and creates a line that approximates the data, letting you easily see historical or future trends.
“Our new enhancements touch on the hottest topics and market trends, helping business users take actions based on predictive data. And because Reveal is easy to use, everyday users get very sophisticated capabilities in a powerfully simple platform,” says Casey McGuigan, Reveal Product Manager.
Machine Learning and Predictive Analytics
Reveal's new machine learning feature identifies and visually displays predictions from user data to enable more educated business-decision making. Reveal reads data from Microsoft Azure and Google BigQuery ML Platforms to render outputs in beautiful visualizations.
R and Python Scripting
R and Python are the leading programming languages focused on data analytics. With Reveal support, users such as citizen data scientists can leverage their knowledge around R and Python directly in Reveal to create more powerful visualizations and data stories. They only need to paste a URL to their R or Python scripts in Reveal or paste their code into the Reveal script editor.
Big Data Access
With support for Azure SQL, Azure Synapse, Goggle Big Query, Salesforce, and AWS data connectors, Reveal pulls in millions of records. And it creates visualizations fast—Reveal’s been tested with 100 million records in Azure Synapse and it loads in a snap.
Additional connectors include those for Google Analytics and Microsoft SQL Server Reporting Services (SSRS). While Google Analytics offers reports and graphics, Reveal combines data from many sources, letting users build mashup-type dashboards with beautiful visualizations that tell a compelling story.
New Themes Match App’s Look and Feel
The latest Reveal version includes two new themes that work in light and dark mode. They are fully customizable to match an app’s look and feel when embedding Reveal into an application and provide control over colors, fonts, shapes and more.


Become a subscriber of App Developer Magazine for just $5.99 a month and take advantage of all these perks.
MEMBERS GET ACCESS TO
- - Exclusive content from leaders in the industry
- - Q&A articles from industry leaders
- - Tips and tricks from the most successful developers weekly
- - Monthly issues, including all 90+ back-issues since 2012
- - Event discounts and early-bird signups
- - Gain insight from top achievers in the app store
- - Learn what tools to use, what SDK's to use, and more
Subscribe here


