IFTTT report shows we love talking to connected devices
Wednesday, July 12, 2017

|
Richard Harris |
State of IoT survey by IFTTT gives insights into what and how smart devices are being utilized.
Almost everything is connected, or wants to be. Taking a stroll down the isles of any electronics store and it’s not so much about the device can do by itself anymore, but what it can do online.
Read more: https://ifttt.com/blog/2017/07/voice-assistant-tre...
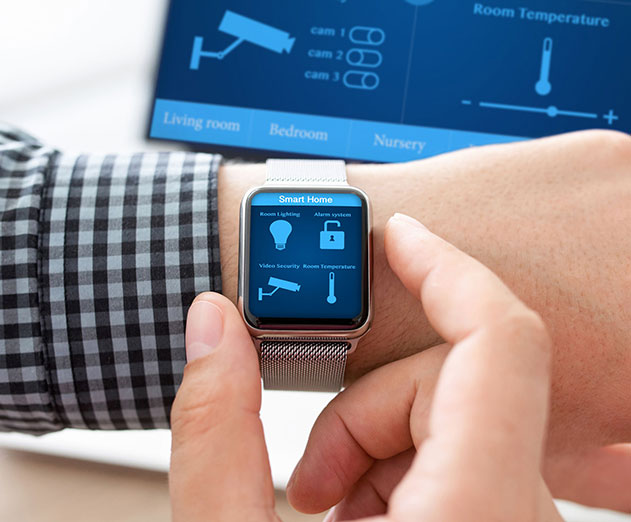
I can testify personally that 80% of my own home is connected now. My electric source has two amp-clamps on it that report live power usage back to me. Most of our lighting is Philips hue controlled, we control the air temperature using the Honeywell system, IP cameras are everywhere, an echo can communicate with almost everything, and even our alarm system is connected. I can pretty much control everything from the web which invites a feeling of excitement, and terror at the same time.
IFTTT (If This Then That) is a platform that lets you program macros for almost anything connected, is sharing new insights into how their users interact with voice assistants such as Amazon Alexa and Google Assistant.
The data offers a snapshot of the most popular use cases of today, as well as the role of voice assistants in year to come.
- Amazon/Echo/Dot/Tap: 69.5%
- Google Home: 17.1%
- Both (Amazon + Google): 7.8%
- Neither: 5.6%
- Smart lighting (Hue, LIFX, etc.): 62.0%
- Wearables (Fitbit, Nike+, etc.): 57.7%
- Smart thermostats (Nest, Honeywell Lyric, etc.): 42.1%
- Smart hubs (e.g. SmartThings, Harmony, Wink, etc.): 39.6%
- Power monitoring & management (Bright, WeMo Smart Plug, etc.): 32.0%
- Smart monitoring systems (Arlo, Nest Cam, Piper, etc.): 23.6%
- Smart locks & garage openers (August, Kevo, Garageio, etc.): 20.4%
- Smart buttons & widgets (Logitech POP, Flic, etc.): 15.6%
- Connected car devices (Automatic, Dash, etc.): 14.1%
- Smart appliances (connected laundry, dishwasher, refrigerator, etc.): 10.8%
- Smart gardening devices (Rachio, RainMachine, etc.): 5.9%
- None of the above: 8.6%
- Bought it myself: 80.2%
- Received as a gift: 20.8%
- Another member of the household bought it: 4.1%
- Less than 6 months: 41.7%
- 6 months to a year: 28.1%
- 1 to 2 years: 21.8%
- Over 2 years: 8.4%
- Stream music: 78.6%
- Control smart lights: 69.6%
- Get the weather forecast: 64.4%
- Set a timer: 58.6%
- Alarm clock and timer: 51.5%
- News: 48.4%
- Control thermostat: 35.2%
- Listen to the radio: 34.8%
- Check traffic conditions: 31.4%
- Access and control your calendar: 27.4%
- Keep track of tasks: 24.4%
- Cooking: 20.7%
- Find your phone: 16.0%
- Audiobooks: 15.4%
- Shopping: 15.2%
- Request an Uber/Lyft: 6.3%
- Games: 5.5%
- Smart home automation not listed: 47.6%
- Other: 7.9%
- 7+ times/day: 28.7%
- 4-6 times/day: 32.7%
- 1-3 times/day: 28.2%
- 4-6 times/week: 3.9%
- 1-3 times/week: 4.7%
- Less than once per week: 1.8%
- Stream music: 74.8%
- Control smart lights: 57.6%
- Set a timer: 51.8%
- Get the weather forecast: 51.5%
- Alarm clock and timer: 32.9%
- News: 32.3%
- Listen to the radio: 28.4%
- Other smart home automation: 23.1%
- Control thermostat: 18.7%
- Check traffic conditions: 15.7%
- Access and control your calendar: 13.1%
- Keep track of tasks: 11.6%
- Find your phone: 11.0%
- Shopping: 9.9%
- Cooking: 9.0%
- Audiobooks: 7.7%
- Other: 6.2%
- Games: 4.2%
- Request an Uber/Lyft: 1.9%
- Check my smartphone: 54.5%
- Ask my voice assistant: 45.5%
- Living room: 61.0%
- Bedroom: 45.6%
- Kitchen: 45.6%
- Other: 13.4%
- Hallway: 2.9%
- You: 97.0%
- Your partner: 69.3%
- Your children: 32.4%
- Guests: 20.6%
- Your roommate: 5.1%
- Other: 2.1%
- Yes: 97.8%
- No: 2.2%
- Much more likely: 62.4%
- Somewhat more likely: 28.6%
- Neutral: 7.5%
- Somewhat less likely: 0.5%
- Much less likely: 0.6%
- Unsure: 0.4%
- Smart security systems, cameras, or locks (e.g Scout, Piper, August Home, etc.): 59.7%
- Connected lights (e.g., LIFX, WeMo Lighting, Philips Hue, etc.): 57.1%
- Smart thermostat or air quality device (e.g. Nest, Ecobee, Honeywell): 42.9%
- Other connected appliance (e.g. OnHub router, Simplehuman sensor mirror, smart
washer/dryer/refrigerator/dishwasher): 34.6%
- Smart hub (e.g. SmartThings, Harmony, Wink, etc.): 31.8%
- DIY electronics (e.g., Flic, littleBits, Maker, etc.): 28.3%
- Connected vehicle or vehicle device (e.g. Automatic, Mojio, Dash, Zubie, etc.): 23.9%
- Fitness wearable or tracker (e.g. Fitbit, Nike +, Jawbone UP, etc.): 16.6%
- None of the above: 5.0%
- Very important: 60.4%
- Somewhat important: 32.5%
- Neutral: 5.6%
- Somewhat unimportant: 1.0%
- Unsure: 0.4%
- Very unimportant: 0.1%
margin of error is +/- 3 percent, with a 95 percent confidence level.
IFTTT (If This Then That) is a platform that lets you program macros for almost anything connected, is sharing new insights into how their users interact with voice assistants such as Amazon Alexa and Google Assistant.
The data offers a snapshot of the most popular use cases of today, as well as the role of voice assistants in year to come.
Do you own an Amazon Echo or Google Home?
- Amazon/Echo/Dot/Tap: 69.5%
- Google Home: 17.1%
- Both (Amazon + Google): 7.8%
- Neither: 5.6%
Do you own any other connected devices?
- Smart lighting (Hue, LIFX, etc.): 62.0%
- Wearables (Fitbit, Nike+, etc.): 57.7%
- Smart thermostats (Nest, Honeywell Lyric, etc.): 42.1%
- Smart hubs (e.g. SmartThings, Harmony, Wink, etc.): 39.6%
- Power monitoring & management (Bright, WeMo Smart Plug, etc.): 32.0%
- Smart monitoring systems (Arlo, Nest Cam, Piper, etc.): 23.6%
- Smart locks & garage openers (August, Kevo, Garageio, etc.): 20.4%
- Smart buttons & widgets (Logitech POP, Flic, etc.): 15.6%
- Connected car devices (Automatic, Dash, etc.): 14.1%
- Smart appliances (connected laundry, dishwasher, refrigerator, etc.): 10.8%
- Smart gardening devices (Rachio, RainMachine, etc.): 5.9%
- None of the above: 8.6%
How did you acquire your voice assistant?
- Bought it myself: 80.2%
- Received as a gift: 20.8%
- Another member of the household bought it: 4.1%
How long have you had a voice assistant?
- Less than 6 months: 41.7%
- 6 months to a year: 28.1%
- 1 to 2 years: 21.8%
- Over 2 years: 8.4%
What were the top reasons you bought your voice assistant?
- Stream music: 78.6%
- Control smart lights: 69.6%
- Get the weather forecast: 64.4%
- Set a timer: 58.6%
- Alarm clock and timer: 51.5%
- News: 48.4%
- Control thermostat: 35.2%
- Listen to the radio: 34.8%
- Check traffic conditions: 31.4%
- Access and control your calendar: 27.4%
- Keep track of tasks: 24.4%
- Cooking: 20.7%
- Find your phone: 16.0%
- Audiobooks: 15.4%
- Shopping: 15.2%
- Request an Uber/Lyft: 6.3%
- Games: 5.5%
- Smart home automation not listed: 47.6%
- Other: 7.9%
On average, how often do you use your voice assistant?
- 7+ times/day: 28.7%
- 4-6 times/day: 32.7%
- 1-3 times/day: 28.2%
- 4-6 times/week: 3.9%
- 1-3 times/week: 4.7%
- Less than once per week: 1.8%
What do you primarily use your voice assistant for?
- Stream music: 74.8%
- Control smart lights: 57.6%
- Set a timer: 51.8%
- Get the weather forecast: 51.5%
- Alarm clock and timer: 32.9%
- News: 32.3%
- Listen to the radio: 28.4%
- Other smart home automation: 23.1%
- Control thermostat: 18.7%
- Check traffic conditions: 15.7%
- Access and control your calendar: 13.1%
- Keep track of tasks: 11.6%
- Find your phone: 11.0%
- Shopping: 9.9%
- Cooking: 9.0%
- Audiobooks: 7.7%
- Other: 6.2%
- Games: 4.2%
- Request an Uber/Lyft: 1.9%
When seeking out information at home, are you more likely to ask your voice assistant or check your smartphone?
- Check my smartphone: 54.5%
- Ask my voice assistant: 45.5%
What rooms do you keep a voice assistant in?
- Living room: 61.0%
- Bedroom: 45.6%
- Kitchen: 45.6%
- Other: 13.4%
- Hallway: 2.9%
Who in your household uses the voice assistant(s)?
- You: 97.0%
- Your partner: 69.3%
- Your children: 32.4%
- Guests: 20.6%
- Your roommate: 5.1%
- Other: 2.1%
Do you think you will still be using a voice assistant five years from now?
- Yes: 97.8%
- No: 2.2%
Has your voice assistant made you more likely to buy a connected device in the future?
- Much more likely: 62.4%
- Somewhat more likely: 28.6%
- Neutral: 7.5%
- Somewhat less likely: 0.5%
- Much less likely: 0.6%
- Unsure: 0.4%
What (if any) connected devices or products are you considering buying?
- Smart security systems, cameras, or locks (e.g Scout, Piper, August Home, etc.): 59.7%
- Connected lights (e.g., LIFX, WeMo Lighting, Philips Hue, etc.): 57.1%
- Smart thermostat or air quality device (e.g. Nest, Ecobee, Honeywell): 42.9%
- Other connected appliance (e.g. OnHub router, Simplehuman sensor mirror, smart
washer/dryer/refrigerator/dishwasher): 34.6%
- Smart hub (e.g. SmartThings, Harmony, Wink, etc.): 31.8%
- DIY electronics (e.g., Flic, littleBits, Maker, etc.): 28.3%
- Connected vehicle or vehicle device (e.g. Automatic, Mojio, Dash, Zubie, etc.): 23.9%
- Fitness wearable or tracker (e.g. Fitbit, Nike +, Jawbone UP, etc.): 16.6%
- None of the above: 5.0%
How important is integration with your voice assistant when choosing a connected device?
- Very important: 60.4%
- Somewhat important: 32.5%
- Neutral: 5.6%
- Somewhat unimportant: 1.0%
- Unsure: 0.4%
- Very unimportant: 0.1%
About the survey
The survey was conducted online and ran April 14-18, 2017. It sampled 1,531 IFTTT users. The averagemargin of error is +/- 3 percent, with a 95 percent confidence level.
Read more: https://ifttt.com/blog/2017/07/voice-assistant-tre...

Become a subscriber of App Developer Magazine for just $5.99 a month and take advantage of all these perks.
MEMBERS GET ACCESS TO
- - Exclusive content from leaders in the industry
- - Q&A articles from industry leaders
- - Tips and tricks from the most successful developers weekly
- - Monthly issues, including all 90+ back-issues since 2012
- - Event discounts and early-bird signups
- - Gain insight from top achievers in the app store
- - Learn what tools to use, what SDK's to use, and more
Subscribe here

_r2f0ox12.jpg&width=800)


