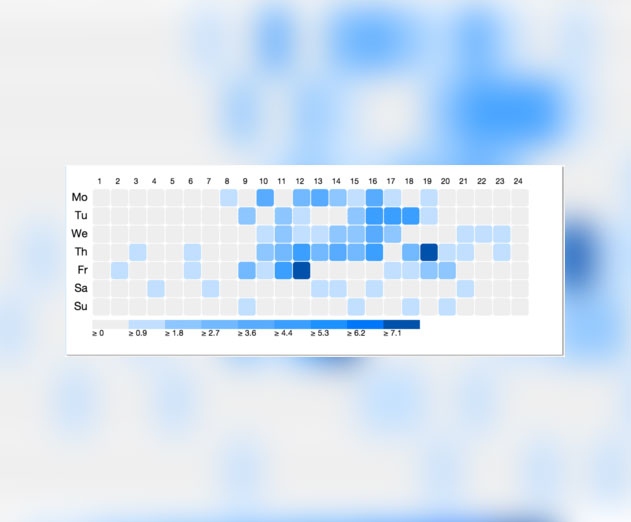
GitHub Push Pattern Heatmap from QuantifiedDev
Thursday, August 14, 2014

|
Richard Harris |
QuantifiedDev has come up with a way to learn something new about yourself with their GitHub Push Pattern Heatmap. The company says that, as far as they know, this is the first time you’ve been able to visualize your GitHub data in this way.
What can you find out? How about which times of the week do you push to GitHub the least? What time was your latest push? When was your earliest?
You can answer all these questions and more in a couple of clicks by linking your public GitHub data with QuantifiedDev. Just sign up, go to the dashboard and click “Link Data.”
Read more: http://www.quantifieddev.org/#/more

Become a subscriber of App Developer Magazine for just $5.99 a month and take advantage of all these perks.
MEMBERS GET ACCESS TO
- - Exclusive content from leaders in the industry
- - Q&A articles from industry leaders
- - Tips and tricks from the most successful developers weekly
- - Monthly issues, including all 90+ back-issues since 2012
- - Event discounts and early-bird signups
- - Gain insight from top achievers in the app store
- - Learn what tools to use, what SDK's to use, and more
Subscribe here


