eBay's vision of INAR
Wednesday, December 4, 2019

|
Richard Harris |
eBay brings our intelligent architecture to provide automated visibility.
Governing and understanding the vast ecosystem in a service architecture is challenging – and with over 3,000 service application clusters in its production system, this is particularly true for eBay. Each application evolves independently with different features and development methods. Efficient development can be inhibited by a lack of documentation and not having proper knowledge about internal customers.
eBay’s vision – known as INAR, Intelligent Architecture – is to build sustainable service architecture by providing automated visibility, assessment, and governance Intelligence. In this pursuit, we developed a new approach to model and process the application ecosystem using a knowledge graph.
A knowledge graph is a commonly used term whose exact definition is widely debated. Basically, a knowledge graph is a programmable way to model a knowledge domain using subject matter experts, interlinked data, and machine-learning algorithms. For eBay, the application/infrastructure knowledge graph is a heterogeneous property graph that improves architectural visibility, operational efficiency, and developer productivity, eventually allowing customers to have a better experience when visiting the site.
This article will explain how the eBay architecture knowledge graph was developed; the benefits eBay has received from it, and the use cases we see now and in the future for this approach.
Three High-level Challenges
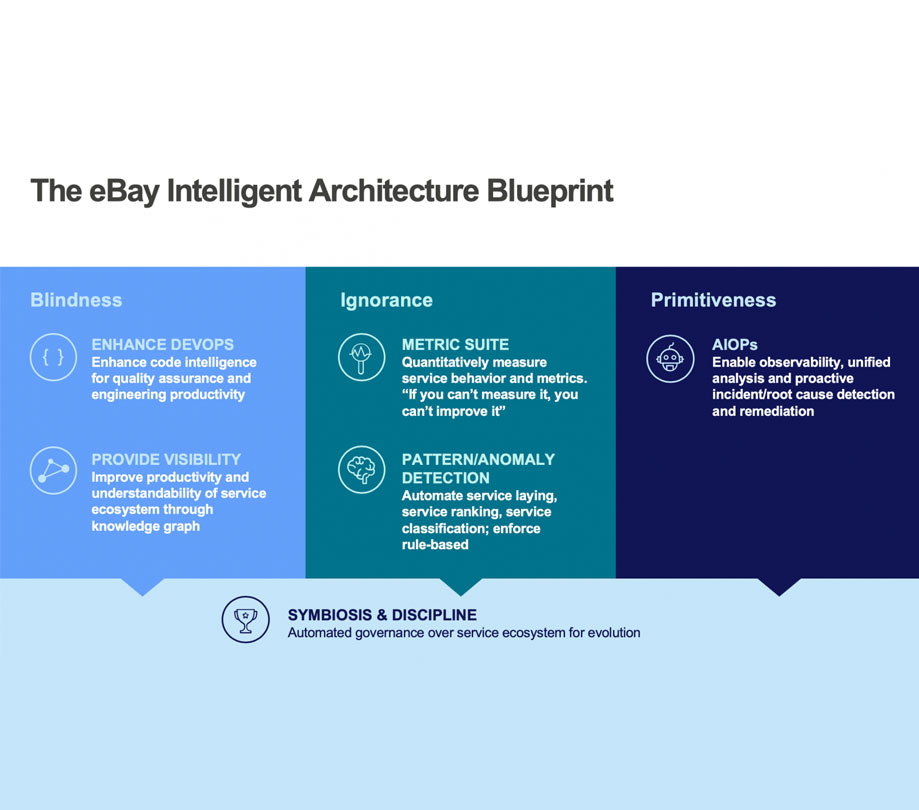
The Intelligent Architecture vision is aimed at addressing three key challenges of a service architecture:
- Blindness: It can be difficult to observe architectural issues such as inappropriate dependencies for software and/or hardware, or to envision the eBay infrastructure and ecosystem with a customized search. This is an issue because popular software and services evolve frequently and become monolithic, resulting in redundant services and duplicated functions.
- Ignorance: Lack of measurability for service architecture or technical debts (additional rework that is required when you take an easier upfront approach that is worse in the long run) can prevent you from developing the metrics you need to improve operational efficiency. As business management guru Peter Drucker famously said, “If you can’t measure it, you can’t improve it.”
- Primitiveness: Diagnostic, engineering and run-time automation are not present. Consequently, artificial intelligence cannot be applied for IT operations, making it difficult to detect anomalies in operations.

It was apparent we needed a clearer understanding of our ecosystem if we were going to serve the needs of our 183 million buyers. Our goal was to provide better visibility, provide pattern/anomaly detection, and automate and enhance IT operations. That led us to the idea of using a knowledge/property graph.
Making Connections: Behavior Metrics and Intelligent Layering
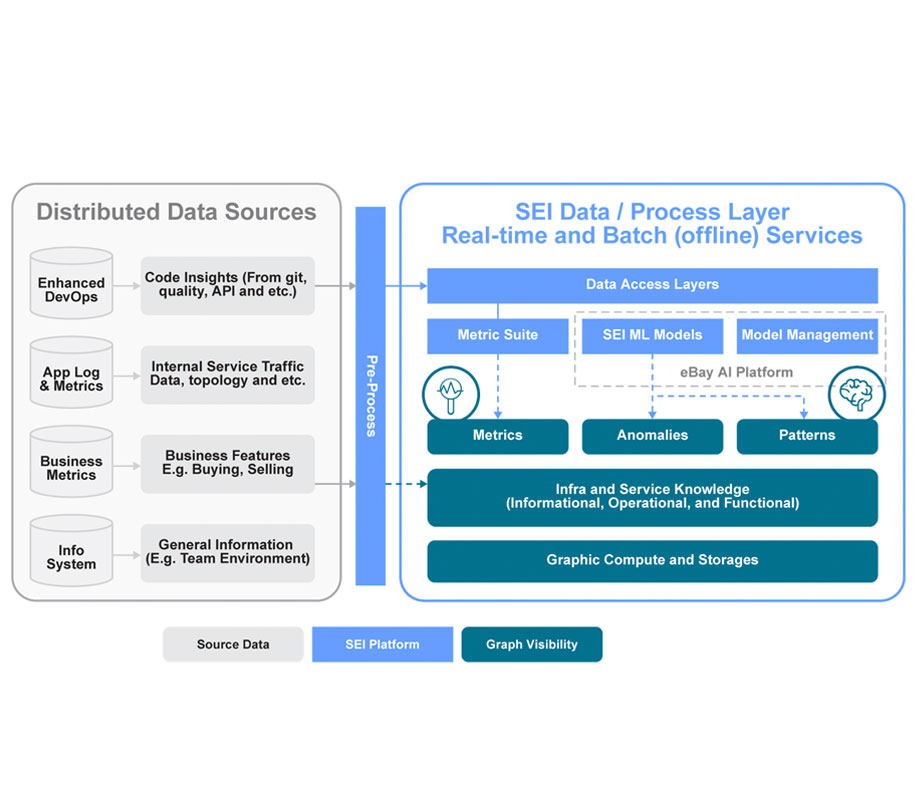
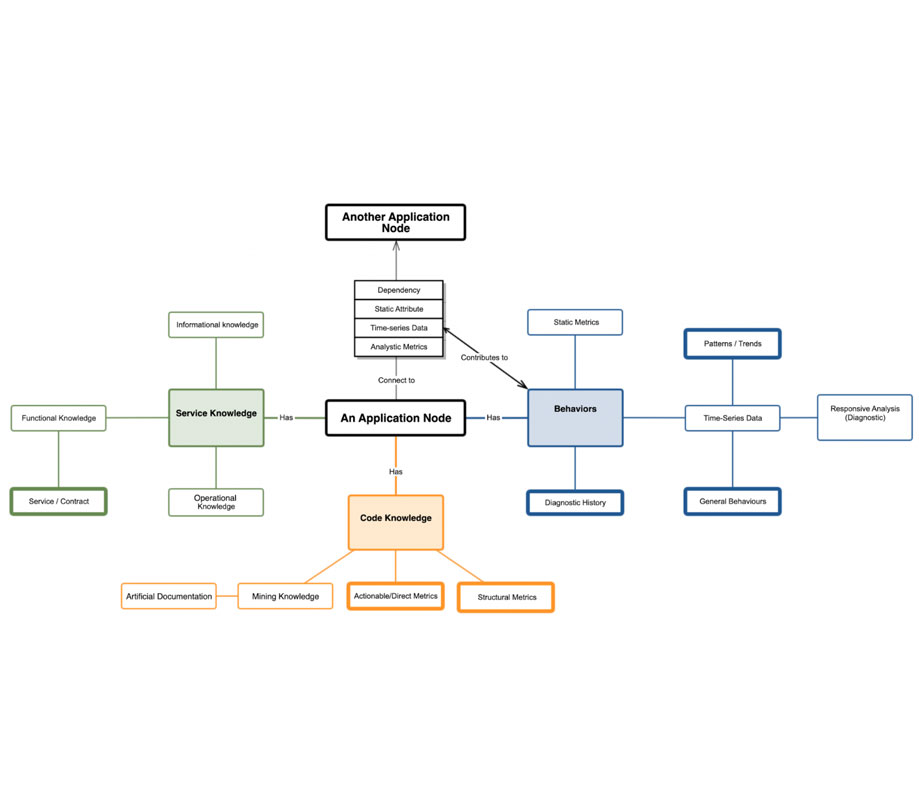
The graph was constructed using real-time metrics, business features, and operational metadata. Ultimately, the purpose of this graph is to connect data sources and break the boundaries between isolated management domains. Here is a depiction at a high level:

One of the first steps in developing a knowledge graph is to calculate the best application metrics and applied machine learning algorithms to automatically cluster the applications. We developed metrics that measured the popularity of applications based on real-time traffic flows and run-time dependencies.
We calculated metrics for all eBay clusters and used techniques called K-means and canopy clustering to cluster all services and based on their popularity scores. This allowed us to organize the ecosystem into different categories, such as how active they are. We discovered that 77% of the clusters are labeled as low-activity.
Seeing Is Understanding: Graph Search and Result Visualization
One of our goals for using a knowledge graph was to improve developer productivity and enable them to retrieve the information they needed more efficiently. Currently, developers have to go through many tools to receive the information they need.
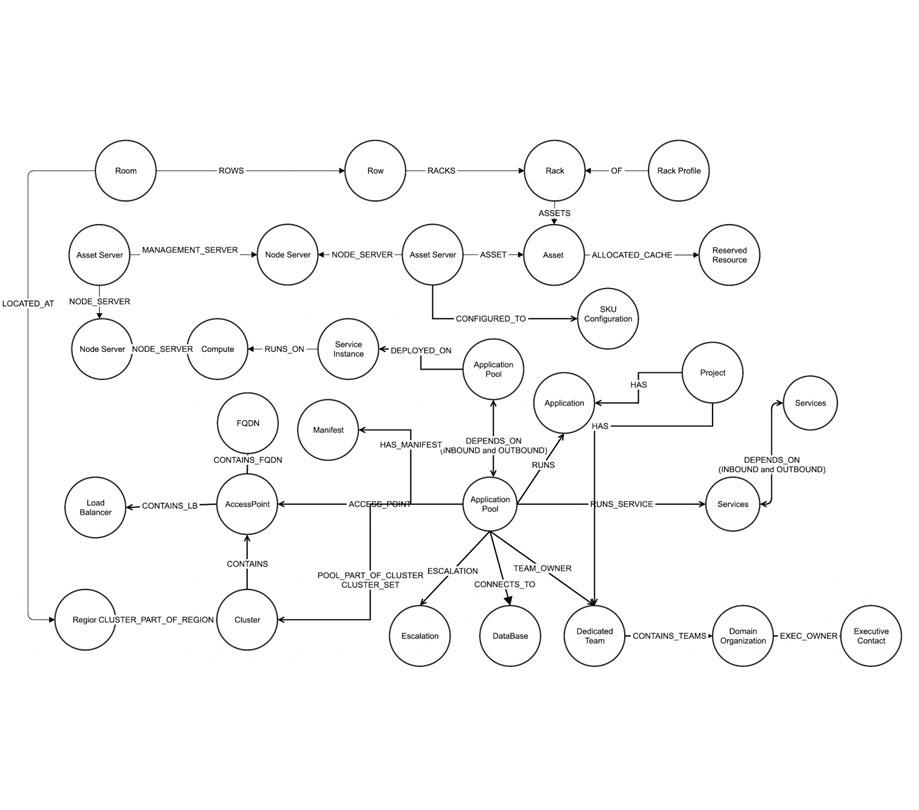
To improve productivity, we built a complete batching system which fetches data from different sources and builds a knowledge graph automatically. We also built an intelligent graph search that dynamically generates a query to explore the knowledge graph, including service metrics and intelligent layering.
By connecting cloud-native data, hardware, people, code and business, we gained better visibility of the ecosystem. The visualization provides rich information in a way that can be quickly understood and acted upon. In the following service dependency example: we randomly picked 18 services and visualize them by one of the default methods. The edge thickness represents edge properties (volumes). Node size represents the behavior metrics. The different colors represent teams or organizations (yellow, for example, is one domain team).

Identifying Inefficiencies
We calculated metrics and intelligent service laying in more than 3,000 eBay production clusters. Three senior architects manually validated the initial results of the popularity metrics and automatic clustering.
The results were surprising and informative. About 10% of the high-activity applications are running under an incorrect availability zone, which can impact operational performance and uptime.
For eBay, the knowledge graph has become an important tool(galaxies) that allows us to provide customizable visualization, application metrics, intelligent layering, and graph search.
The system provides top-down and bottom-up view of the application, along with the dependencies and increased accuracy; enrich data to enforce application compliance; governance with clear ownership details; and operational performance recommendations.
Moving forward, we plan to enhance the graph to support site anomaly detection by presenting suspected events on the graph with full causality details of each incident.
We also plan to extend this graph to include service API metadata, which will enable service layering, recommendation and clustering. The knowledge graph promises to become a critical tool for understanding our ecosystem and meeting customers’ expectations for continually faster and better service.


Become a subscriber of App Developer Magazine for just $5.99 a month and take advantage of all these perks.
MEMBERS GET ACCESS TO
- - Exclusive content from leaders in the industry
- - Q&A articles from industry leaders
- - Tips and tricks from the most successful developers weekly
- - Monthly issues, including all 90+ back-issues since 2012
- - Event discounts and early-bird signups
- - Gain insight from top achievers in the app store
- - Learn what tools to use, what SDK's to use, and more
Subscribe here

_r2f0ox12.jpg&width=800)


