Programming
ShieldUI Updates Reportivo Reporting and Sharing Service for JavaScript and HTML5 UI Components
Tuesday, March 4, 2014

|
Stuart Parkerson |
After their recent announcement of the addition of 12 new controls to their JavaScript and HTML5 UI components suite, ShieldUI is now in the final stages up updating its Reportivo online reporting and sharing service to utilize these controls.
Reportivo.com is a free online service designed to help users analyze data and create insightful reports for informed decision making. Based on thorough research as to the key requirements of the modern business person, Reportivo brings everything in a solution which can be used by people of various professional backgrounds for reports of different frequency.
Yet the most notable thing about Reportivo.com is that no technical knowledge or training is required to create reports and to fine-tune them. ShieldUI’s primary goal is to utilize the capabilities of its components in creating a free online solution which solves a number of problems that users face when creating such reports. The sections here outline one sample set of steps when generating and sharing a visualization with Reportivo, as well as the problems and limitations which the service strives to solve.
Setting up the data
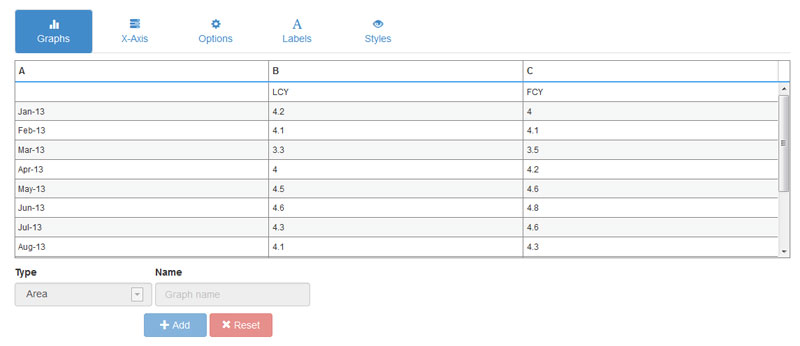
An integral part of each report generation process is the selection of data which will be visualized in it. Many applications have to solve this problem which requires database queries as well as cross selection and filtering of data in order to provide the subset of meaningful data. Reportivo makes this easy to do by exposing a simple upload process which accepts Excel or CSV files.
To facilitate user interaction, the service renders all the data contained in the uploaded file in a standard grid layout. A sample output graphic is included here.
The Reportivo approach solves another challenge – data selection.
Selecting the data
Even when using specialized components for visualizing a set of data, one still needs to use some code in order to setup the controls, reference all required scripts or dlls and pass the actual data which will be rendered. Not to mention the painstaking process of setting all visual properties via code. Reportivo eliminates this requirement by rendering all uploaded data in a grid widget which allows selection. Iteratively selecting data for each chart series in the generated report is the first step in visualizing the data. The selection is handled by simply drag-selection a data-section from the grid component.
Enabling more options
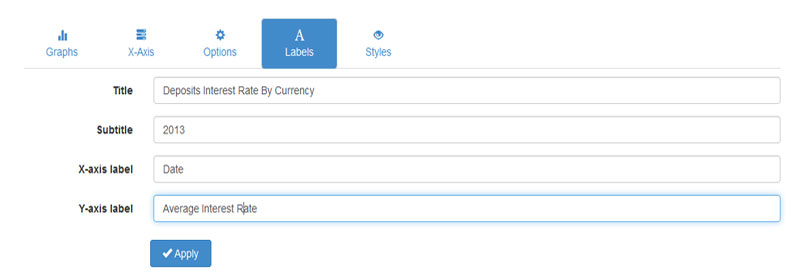
The same intuitive UI design and no need for coding concept is applied to the report and chart series customization. Simply selecting the options from a list of presets automatically enables them for the final data visualization. These are available for either the individual data series or the whole chart control.
Reportivo enables a great degree of flexibility and visual options for the rendered report. Since the service employs the ShieldUI Charting component, Reportivo offers over 23 charting visualization types and a rich set of interactivity, tooltip and interaction effects.
Sharing the report
When working collaboratively as part of a team, a report generation process, or for data visualization, implementation is rarely simply just about generating the visual result but also about sharing data. Reportivo solves this collaboration problem by enabling easy report sharing. Once a report is finalized, it is saved and can be linked via a unique URL. Then it can be shared it or embedded in a web page with the click of a button. To add an even bigger degree of flexibility, Reportivo allows programmatic report customization and generation.
Reportivo API
Adding data to an existing report is easy to achieve. To modify that data, simply add a dataSeries.data parameter to the URL and assign it the comma-separated list of new values. For example - dataSeries.data=19,20.5,30.5,10,5,15
For the tech-savvy Reportivo offers a fully functional REST API which will automatically generate a report over a POST request which contains a JSON structure specifying the chart structure and options. More details on this approach are available here.
The future plans of the company include greatly extending the reporting capabilities of Reportivo by moving from a chart visualization towards a dashboard design, which allows pre-selection of controls and tools to use in the final report.
Feel free to review and test the service here, or visit ShieldUI for a review of all controls used in it.
Read more: http://reportivo.com/create

Become a subscriber of App Developer Magazine for just $5.99 a month and take advantage of all these perks.
MEMBERS GET ACCESS TO
- - Exclusive content from leaders in the industry
- - Q&A articles from industry leaders
- - Tips and tricks from the most successful developers weekly
- - Monthly issues, including all 90+ back-issues since 2012
- - Event discounts and early-bird signups
- - Gain insight from top achievers in the app store
- - Learn what tools to use, what SDK's to use, and more
Subscribe here


