How to calculate app lifetime value
Tuesday, July 24, 2018

|
Jonathan Raveh |
Learn how to study your mobile user metrics to determine a key element in mobile marketing known as Lifetime Value to help you build an audience that keeps your app installed.
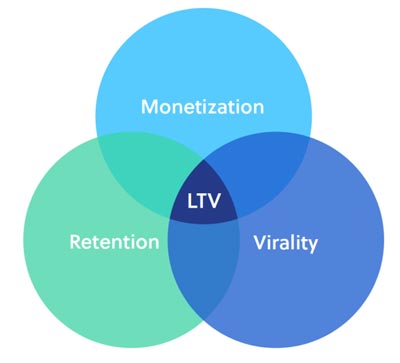
It’s safe to say that one of the most common struggles of any mobile-first company is understanding the value of their customers. With this in mind, user Life Time Value (LTV) is not only one of the most powerful business KPIs, but also serves two more roles - a great tool to plan for future growth, and a constant reminder of the ever-growing importance of user loyalty and retention as critical success parameters. LTV is both an everyday tool and a pillar for any long-term growth strategy.
Calculating LTV isn’t quite as simple as it seems. There are a number of ways to reach it, depending on app vertical, level of complexity, etc. The simplest method is to divide the entire revenue for a certain period by the total number of users for that same period:

While this method is simplistic enough, it’s far from perfect. It doesn’t take into account the various stages of the users’ lifetime cycle, segments, or verticals. More importantly, it includes active users that have yet to generate app revenue (a user with a $0.00 revenue value). While complex methods are out of the question for a KPI that’s part of your daily routine, there is still a way to reach a fairly accurate user LTV result without being dragged down the rabbit hole.
Main LTV Components
To figure out the ideal equation, let’s first understand what parameters actually contribute to an app’s user LTV.
Revenue: The monetary aspect of an app, specifically the amount of app revenue driven from users. App revenue can be driven from various revenue models - advertising, subscriptions, in-app purchase, e-commerce, and more. Regardless of business model, revenue calculation takes into account all revenue components in that timeframe.
When calculating LTV, taking revenue into account is not enough. What we should figure out is the revenue that each user generates - the ARPU, average revenue per user.
APRU is not only simple enough to wrap your head around, but it is also quite simple to calculate. What makes it more challenging is choosing the appropriate time period to measure. Since most app users do not use the app every single day, 24 hours doesn’t constitute an accurate enough timeframe. On the other hand, looking at long timeframes can lead to imprecise results. For this reason, most app developers use 30 days as the designated timeframe to measure ARPU. This coincides well with the retention measurement.

Retention: The holy grail of app engagement. The retention components basically measure the frequency of engagement (rather than length or quality of each engagement). Retention curves are most commonly the first, and most important, data in most app analytics and attribution services - TUNE, Appsflyer, Adjust, and others. With less than 10 percent of app users retained after the first 30 days of installing it, this is clearly one of biggest challenges currently faced by app growth marketers and the industry as a whole. Retention-centric data as a whole considers not only the level of engagement a customer has with your app but also the length of the average customer lifecycle.
Measuring Revenue: Since the revenue factor is measured for a 30-day timeframe, so should retention. That means ‘revenue’ and ‘retention’ should be measured over identical timeframes, not only in length but also in date (i.e., not only ‘30 days’ but ‘January 2018’ as well).
Understanding retention is possible by calculating user churn:

Retention is then simply 100% minus churn. That is, if your 30-day retention is 30%, this means you have a 70% churn rate for that period.
Virality: Virality generally refers to the number of users who installed the app due to a referral from an existing app user. Virality is a huge growth metric, and apps with high viral factors tend to be very successful. In terms of user quality, there’s nothing like a recommendation from a friend. On the other hand, it’s quite difficult to measure virality, and analytics services do not currently offer a sufficient solution for tracking it. If you do manage to figure this out, your referral value will be a derivative of your standard users LTV. If not, just use ‘0’ as your referral value.
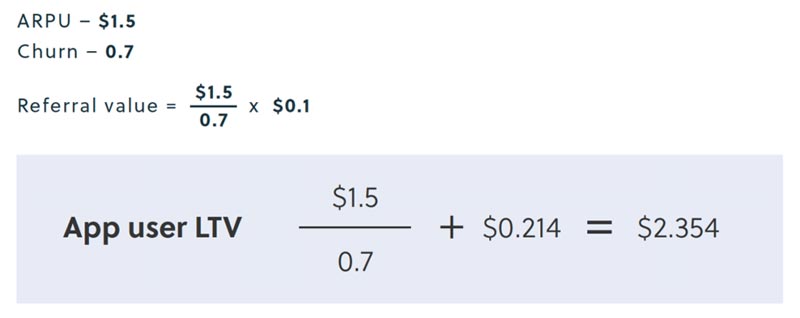
Calculating App LTV: We’ve figured out how to measure revenue, retention, and virality metrics. Now, you’re ready to calculate your users’ LTV. This formula is an advanced, optimized version of the simple way to calculate LTV:

Remember, when calculating user LTV:
- ARPU = Revenue factor
- Churn = Retention factor
- Referral Value = Virality factor
Example:
If an app’s average user generates $1.5 per month and after 30 days, the app’s retention rate is 30%, then on average, 10 users bring in one additional user to install the app (so a user brings 0.1 new app users on average). The referral value then multiplies this value by ARPU/Churn.

Now what?
What is the first thing you should do with your App LTV? First, definitely compare it with your user acquisition cost. In this specific example, if the cost of acquiring a user is less than $2.35, you’re doing well. You have a positive ROI (return on investment) at the user level. If not, you need to make some changes. Either reduce the cost of acquiring your users or increase your LTV by:
- Increasing the virality factor
- Optimizing the commercial offering to increase revenue
- Improving engagement and retention
More often than not, developers will focus on items 1 or 2. Virality has a massive effect on acquisition costs (as an organic user theoretically doesn’t cost anything), and revenue is the main focal point for most of the growth/products endeavors. In most cases, however, low retention is a major challenge that most app developers face today, yet is commonly ignored. Lack of personalization and insufficient tools force marketers to spend more of their budget on user acquisition and reaching similar results, rather than focusing their efforts on their existing users to increase app engagement, prolong user lifetime, and subsequently improve user LTV. This is due in part because tools for retention were unavailable until recently. Applying meaningful personalization to apps by using real-world data can revolutionize not only the way apps understand their users and interact with them, but also the way they can become commercially successful.
This content is made possible by a guest author, or sponsor; it is not written by and does not necessarily reflect the views of App Developer Magazine's editorial staff.

Become a subscriber of App Developer Magazine for just $5.99 a month and take advantage of all these perks.
MEMBERS GET ACCESS TO
- - Exclusive content from leaders in the industry
- - Q&A articles from industry leaders
- - Tips and tricks from the most successful developers weekly
- - Monthly issues, including all 90+ back-issues since 2012
- - Event discounts and early-bird signups
- - Gain insight from top achievers in the app store
- - Learn what tools to use, what SDK's to use, and more
Subscribe here


