New Relic Releases Updates to Software Analytics Cloud Monitoring
Thursday, March 17, 2016

|
Richard Harris |
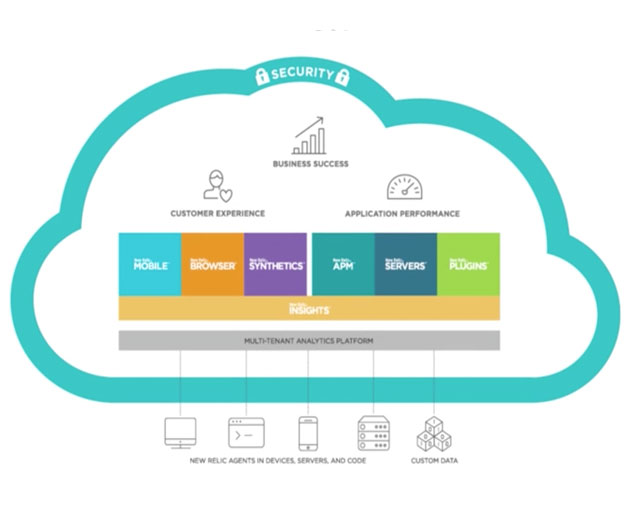
New Relic has announced a new set features for the company’s New Relic APM, New Relic Synthetics, and New Relic Browser which are part of the New Relic Software Analytics Cloud platform.
The new release increases the ability for the New Relic platform to offer visibility and diagnose/resolve performance problems. The platform provides a monitoring solution allowing software teams to work together to monitor from different perspectives for any technology stack. It provides team leads with the ability to monitor and identify issues that may impact the performance of applications, understanding which customers may be impacted, and enables collaboration with developers and DevOps teams to address an issue.
The following new features are now available:
New Relic APM
- Increased Visibility within Service Maps: IT operations teams now can understand how the performance of a single service node is impacting the entire system without leaving the Service Map. With a single click, an inline chart appears for that node, allowing the team member to see key performance metrics, as they begin their investigation.
New Relic Synthetics
- New Public Locations: Now with five additional locations, New Relic has expanded the geographic footprint customers can run synthetics scripts to monitor and test their site across the United States and Europe.
- Private Locations. Private Locations allow operations teams to run synthetics scripts from any location by installing an appliance to monitor internal applications hosted behind a firewall and performance close to the company’s major markets or customers.
- New REST API. New testing and deployment workflows are now possible with the release of the new Synthetics API, allowing monitors to be automatically updated as part of a build pipeline for a more integrated application release process. The new API can also be used to better manage thousands of monitors at production scale, with programmatic control to quickly and easily setup, configure, and manage monitors across application portfolios.
New Relic Browser
- Filterable Geography: New Relic’s analytics engine is now embedded within New Relic Browser, and powers an interactive global map that enables IT operations professionals Filter data by Page URL, ASN Organization/Internet Service Provider, Browser Type, User Agent Operating System, Session, and more. It also provides the ability to graphically view high-traffic areas at the country, region, or city level. Also new is the opportunity to view network timing data, including DNS Lookup Duration, Connection Establishment Duration, and Secure Handshake Duration.
Read more: http://newrelic.com/

Become a subscriber of App Developer Magazine for just $5.99 a month and take advantage of all these perks.
MEMBERS GET ACCESS TO
- - Exclusive content from leaders in the industry
- - Q&A articles from industry leaders
- - Tips and tricks from the most successful developers weekly
- - Monthly issues, including all 90+ back-issues since 2012
- - Event discounts and early-bird signups
- - Gain insight from top achievers in the app store
- - Learn what tools to use, what SDK's to use, and more
Subscribe here


