Enterprise
Metrics Versus KPIs Putting Numbers in Their Places
Thursday, December 31, 2015

|
Don Vilsack |
As a quality assurance professional who has been involved with process improvement for nearly two decades, I continue to be surprised by the number of developers, testers, and other software team members who do not recognize the difference between metrics and key performance indicators (KPIs).
This is not surprising, because in the business world - especially in the realm of business data analytics - it is fairly common to see the term “metrics” used to identify what are actually KPIs.
In software engineering, if metrics and KPIs are being confused or used interchangeably, it generally means that stakeholders are not defining and building out KPIs, and software teams are not using them effectively. At the end of the day, these incorrect assumptions diminish the quality and amount of actionable information that can help reduce defects and promote a better outcome.
The Difference Between Metrics and KPIs: Why You Should Care
From a generic perspective, the term metric covers a wide range of numeric measurements (including the data in KPIs), but for the purposes of this article, we are referring to the raw data that testers, developers, and other team members identify and extract to obtain information about their efforts.
The root of the word metric is the Greek word metron, meaning “measure,” and that’s exactly what a metric is, from this perspective. It is a statistic, pure and simple, that doesn’t answer any questions or provide any insight until it is used in the context of a KPI.
Definitions of KPI are all over the map, but a logical definition, I believe, is this: “A KPI is a SMART measurement, linked to a target value, that provides actionable data and allows individuals to make insightful and informed decisions. A KPI provides vision into how effectively a company and its teams are pursuing stated team objectives to achieve management-defined goals. KPIs should always be derived and managed using the SMART methodology.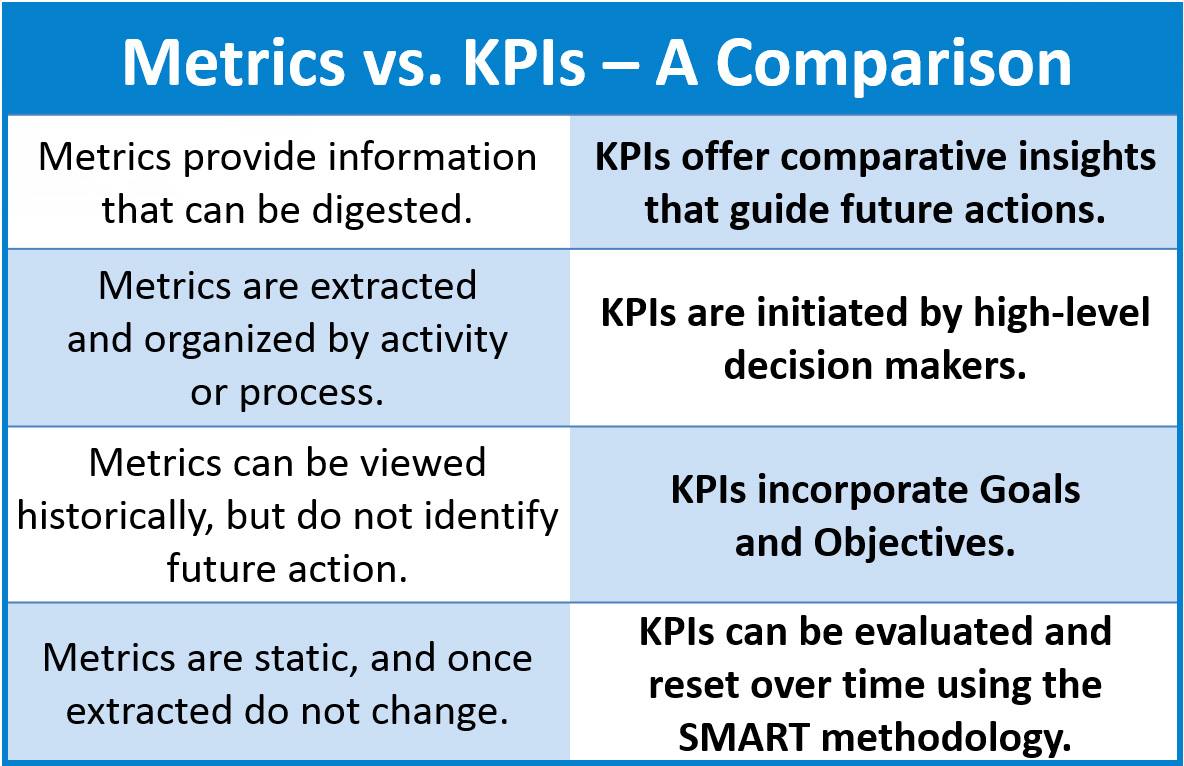
(In case you are not familiar with the term, SMART is an acronym for specific, measurable, achievable, realistic, and time-bound. SMART methodology is the hallmark of many successful business initiatives, and it is deeply applicable to software engineering. SMART is a critical component of success with goal and baseline setting for KPIs.)
At this point, you may be thinking, “Wait a minute. All metrics are actionable. If metrics show me that the number of defects is rising, and our team knows management won’t be happy about that, we can take action to reduce them.” The problem with this assumption is that such an approach doesn’t provide a structured framework for actionable, measurable, continual improvement. Here’s a brief example:
- The metric consists of raw data: The application has 25 defects.
- The team takes this data and structures it into a grid of rows and columns by severity. 1 is critical, 2 is high, 3 is medium, 4 is low. The ranking of defects by severity provides more metrics, but there is no stated goal or objective relating to improvement. There is no action item, so there is no KPI.
- The team checks the prior release and sees that there were 22 defects in the past release, with 25 defects in this one. The team now has trending data, as well, but there is still no KPI.
Turning Metrics into KPIS
I have sat in meetings where teams looked at metrics similar to the ones I mentioned earlier, and the team lead or manager said, “Twenty-five defects is too many. Let’s work on reducing that number.” In their minds, the KPI is the metric - 25 defects.
Maybe the team takes things a step further and frames the metric in the context of a directive - usually from a senior manager or director. That might result in the statement, “Let’s reduce the number of defects in production by 10 percent, for each of the next 10 releases.”
At this point, they have a metric - 25 defects - and a specific goal that is measurable and time bound - 10 percent reduction in the number of defects, per release, over 10 releases. However, they do not have a SMART goal or objective to work toward, so they still do not have a KPI.
To derive the KPI and make it actionable over time, the team will perform the following steps.
1. Confirm that the metric is reliable.
- The team evaluates the number of defects, on average, over the past 10 releases and finds that the average was also 25.
2. Determine the amount of reduction that should occur with the first release.
- Ten percent of 25 is 2.5. Since defects must be reduced by whole numbers, the team rounds up to 3 defects for the first release. The baseline for achievement is 22 defects.
3. Create a barometer for measuring achievement.
- A defect number of 22 or less achieves the objective, creating a Green status.
- A defect number of 23-24 warns of trouble, creating a Yellow status.
- A defect number of 25 or above indicates failure, creating a Red status.
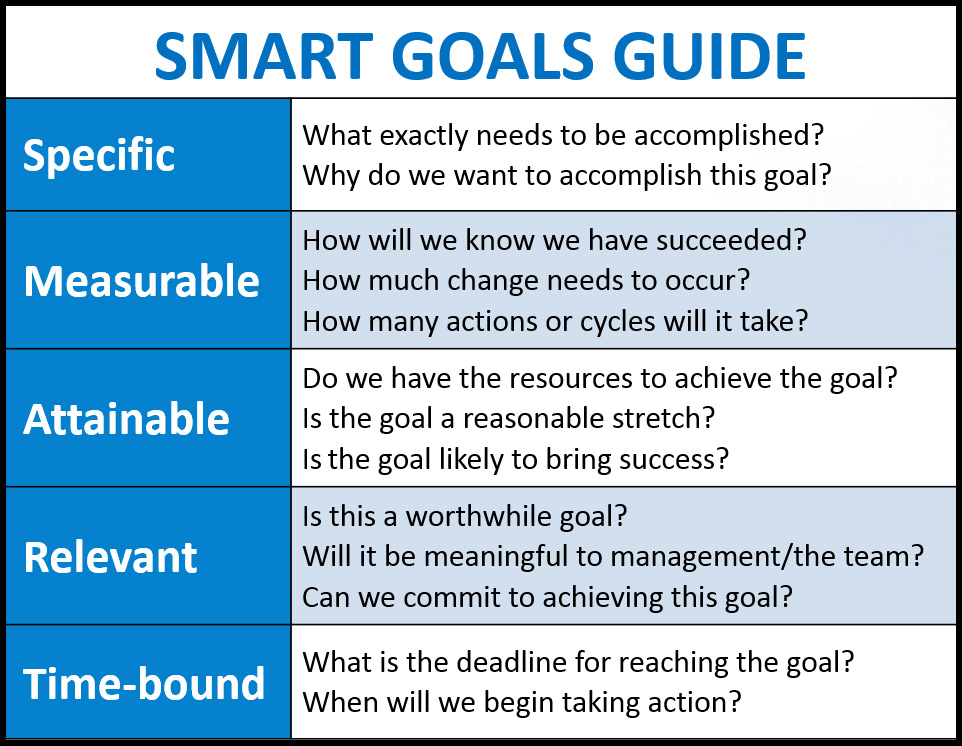
SMART Goals Guide: Until KPI measurements and goals have been validated through the SMART methodology, they will not produce optimal results.
To put the KPI into action, the team or its leadership will:
1. Measure and record the number of defects after each release, performing periodic checks.
- Although the final number will be the average of all 10 results, leadership will evaluate the average after a few releases to check progress toward the objective.
2. Reset the baseline for achievement, as appropriate.
- Resetting the baseline should not be automatic each time an objective is achieved, due to the variables involved in the complexity of each release. To stay SMART, prudent leaders will confirm progress over the average of several releases before resetting the baseline.
3. Evaluate the achievement or lack thereof using SMART methodology, report to upper management, and make informed decisions about the next steps based on leadership input.
- Depending on whether or not the overall objective was achieved, management may wish to continue with the improvement initiative as-is or make it more or less aggressive. Team leadership will again be using SMART methodology to confirm all objectives.
Extending the Value of KPIs
KPIs not only enable teams and their management to determine and act upon the severity of problems and the statuses of improvement efforts; they also provide “lines in the sand.” I have seen teams not familiar with the true nature of KPIs establish objectives like “30 percent +/-.” Because such a measurement is subjective and has no hard parameters, it cannot be part of a KPI.
Furthermore, as I alluded earlier, the use of historical data in KPI development creates a feedback loop that both ensures anomalies are not skewing the baseline and gives management a more effective view into improvement over time. This information can also be structured and displayed as attractive visuals, such as fuel gauges and bar charts that everyone can consume easily.
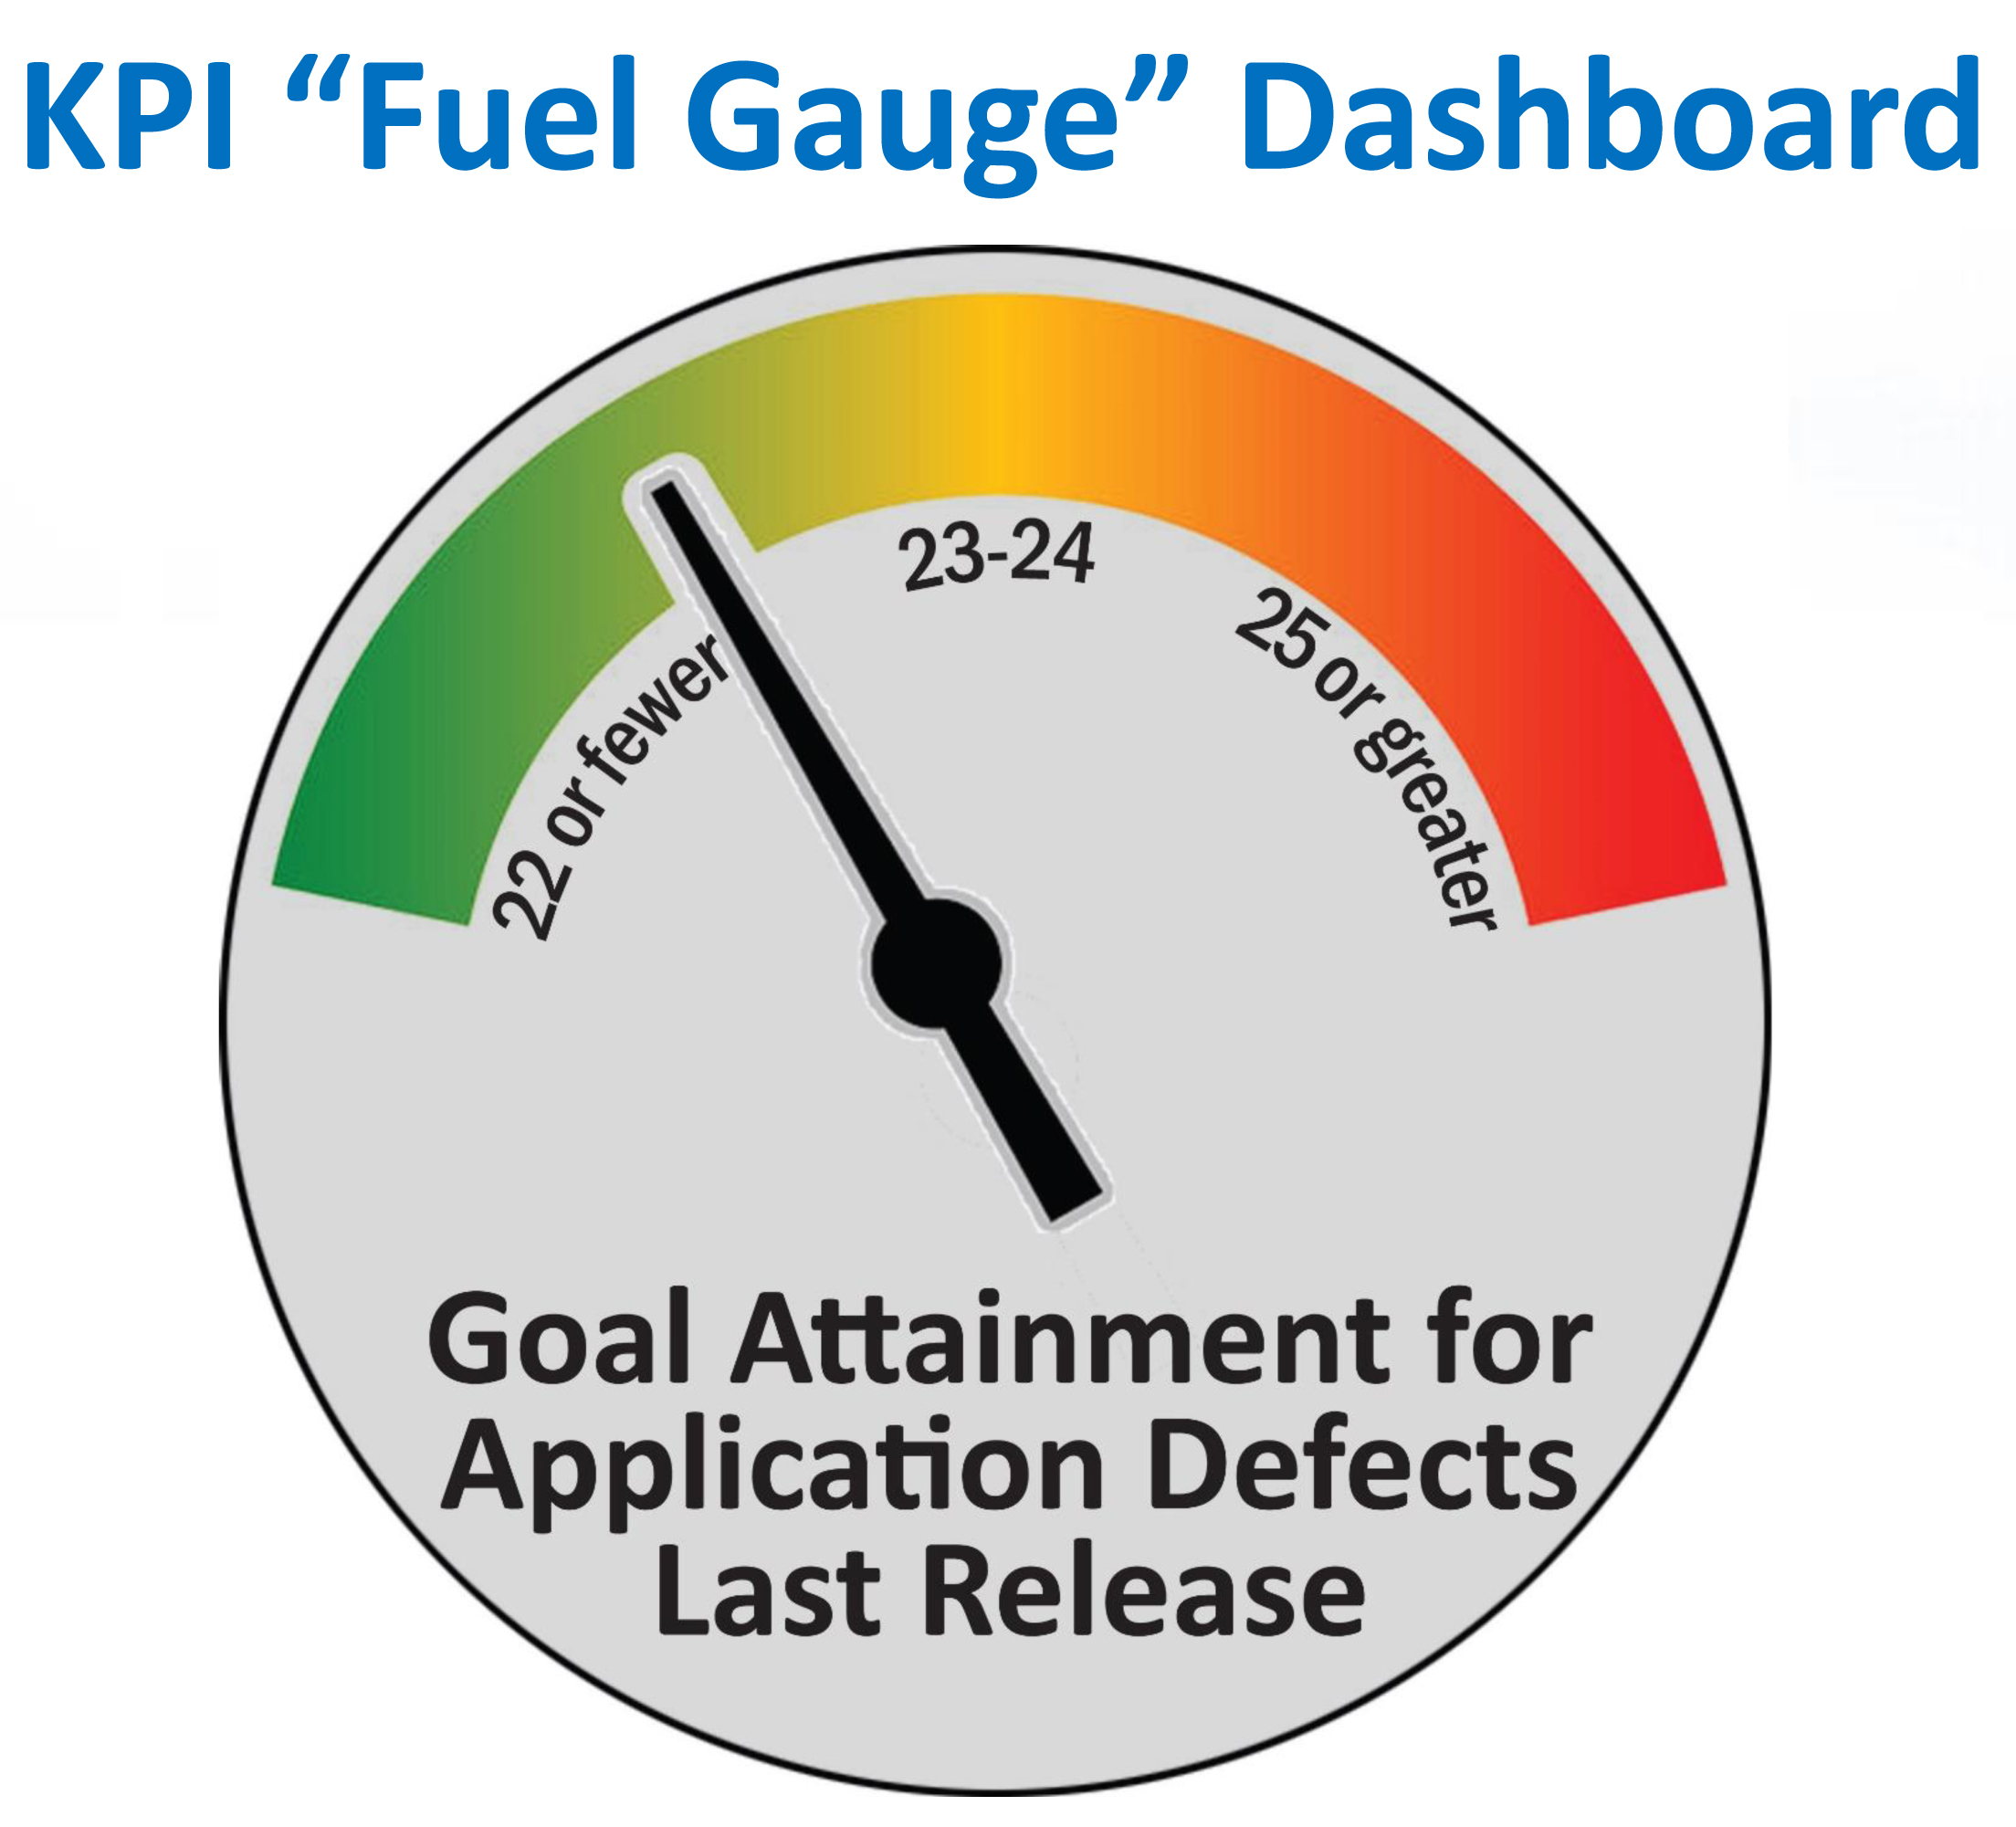
Defects by Severity and KPI Fuel Gauge Dashboard (Use both): Organizing defects by severity and tracking them over time provide information, but the result does not reflect a goal or progress toward that goal. Graphical representations of KPIs, such as this “fuel gauge” barometer, can provide actionable insight in an easily digestible format.
As time progresses, leadership can evaluate KPIs in the context of other factors to make adjustments, if needed. For example, if the number of defects suddenly jumps after a period of overall downward stability, management may discover that the number of updates in each release has also increased dramatically. Using that information, leadership can decide if it wants to delay some updates to maintain application quality or adjust its objectives to accept a temporary spike.
Having true KPIs also enables management and its teams to turn attention away from efforts that are moving in the right direction, overtime. In doing so, they can focus more closely on emerging issues or revisit those that are not progressing toward their objectives at a reasonable pace.
The Bottom Line
In summary, KPIs provide insight into a project and its effort and provide data that is actionable and reliable to make informed decisions. Although we illustrated them here in the context of software testing, they can be extremely valuable in every phase of the software lifecycle.
However, until software teams understand the difference between KPIs and metrics and use both properly, they likely cannot develop appropriate performance goals and objectives, nor can they establish a feasible path to achieve them - or even to determine if they are achievable.
As a result, they are usually unable to measure their own efforts effectively, making it difficult, if not impossible, to achieve meaningful improvement over time. At the end of the day, that’s perhaps the greatest value that KPIs - and not metrics - bring to the table. They enable a steady, measured, sustainable march toward superior quality, not over 10 days or 10 weeks, but rather for the lifecycle of the application.
Read more: http://www.orasi.com/
This content is made possible by a guest author, or sponsor; it is not written by and does not necessarily reflect the views of App Developer Magazine's editorial staff.

Become a subscriber of App Developer Magazine for just $5.99 a month and take advantage of all these perks.
MEMBERS GET ACCESS TO
- - Exclusive content from leaders in the industry
- - Q&A articles from industry leaders
- - Tips and tricks from the most successful developers weekly
- - Monthly issues, including all 90+ back-issues since 2012
- - Event discounts and early-bird signups
- - Gain insight from top achievers in the app store
- - Learn what tools to use, what SDK's to use, and more
Subscribe here


