
Marketing & Promotion
Analyzing an App’s Potential Using App Annie
Tuesday, June 3, 2014

|
Artyom Dogtiev |

Questions such as “How do I find a profitable app” and “How much profit does an app bring” are key when investors are making a decision about adding new apps to their portfolio.
The fact is, there is no way to figure out how much income an app makes directly, unless you have access to the app’s sales numbers. In this article, we will show you the best way to get indirect numbers by using solutions from App Annie - a well established analytics provider. Here at ComboApp, we use this service on a regular basis, so we’re a bit biased towards it. (We should point out that there are comparable alternatives to App Annie, such as AppFigures, AppData and others. Feel free to give them a try using the same strategy.)
Before we begin, in order to use/see the entire set of features that App Annie provides, you’ll need to register for an account. It is free and pretty quick/painless and we recommend you do so before continuing to read this article.
The reason we like App Annie so much, is because the tool provides you with mountains of quantifiable, rich data about an app. Let’s take a look at all of the information you can find on App Annie that will help you to determine how profitable your prospective app might be.
When was the app released?
When looking at the iOS App Store and Google Play, you can only see the date of an app’s latest update. With App Annie you can find the date of the app’s first release: Simply choose “All Time” from the date range. The starting point on the graph the dashboard produces marks the exact date the app was first released onto the market.
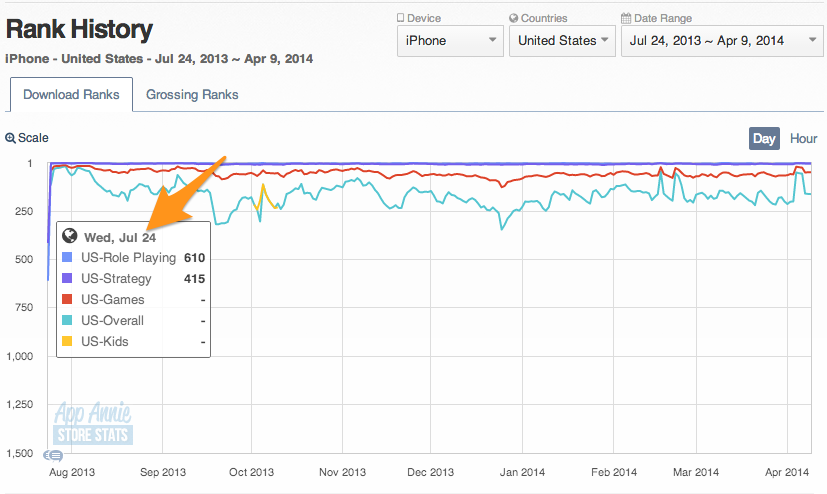
Keep in mind, you’ll be looking at app release dates for a specific country. Developers might possibly launch an app in a different country’s app store using a soft launch strategy to allow initial feedback on the app from a market with less apps/competition which would require smaller marketing outlays. Even so, soft launch statistics won’t change much in the process of the overall analysis of the app’s potential. But, it’s good to be aware of this possibility.
If the owner of the app you’re interested in provides you with statistics about the weekly profit being generated by their app, it is important that you not just multiply that statistic by the number of weeks that the app has been on the market, as that won’t produce a reliable number that represent the profit the app has been making over its’ life in the market. You should look carefully at when/how many times the app’s ranking has or has not changed within the app store - this will be an important piece of information to add context to your analysis.
How often were app updates issued? How did those updates influence the app’s ranking?
At the bottom of the graph shown here you’ll see “ToolTip” signs. If you mouse over those icons while in the App Annie dashboard, it will provide you with the dates that all app updates occurred.
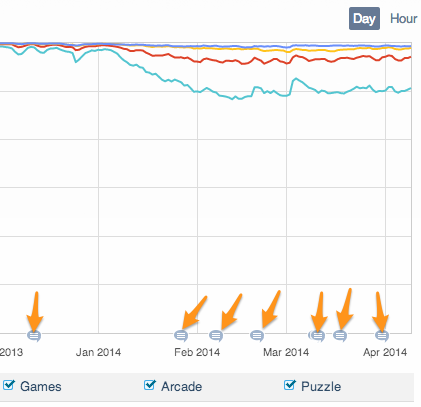
ToolTip information includes:
- Update release date
- App version number
- Any change in the app’s price (paid apps)
- Any change in the app’s category (if relevant)
By analyzing this data you can track the correlation between the updates and the number of downloads in the same periods. The TOP Grossing chart is also important to analyze along with this data, as it will give you a good picture if a certain update substantially helped to generate more profit for the app.
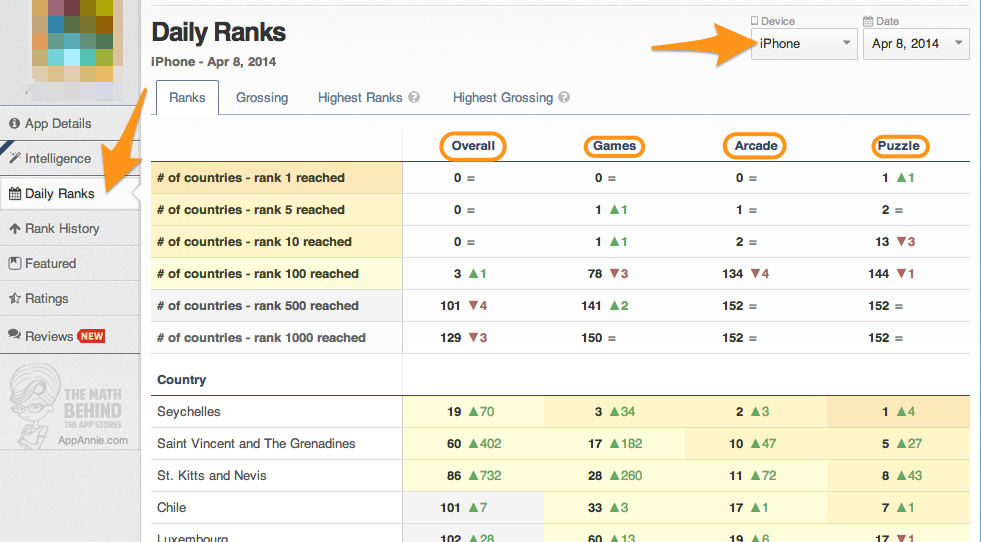
In what countries is the app doing best?
The Daily Ranks tab will give you this information. In this tab you can check the current ranking of your app on the TOP charts in a number of different countries. Notice that for universal apps you’ll see its current position for the iPhone version only, you need to make sure you check the iPad version’s ranking as well. (Universal apps are those which are compatible with both iPhone and iPad.)
How to reveal an app’s biggest achievement of all time?
First, let’s define what an “achievement” for an app may be. For purposes of this article, let’s consider these events as achievements:
- The top position in a chart on the App Store
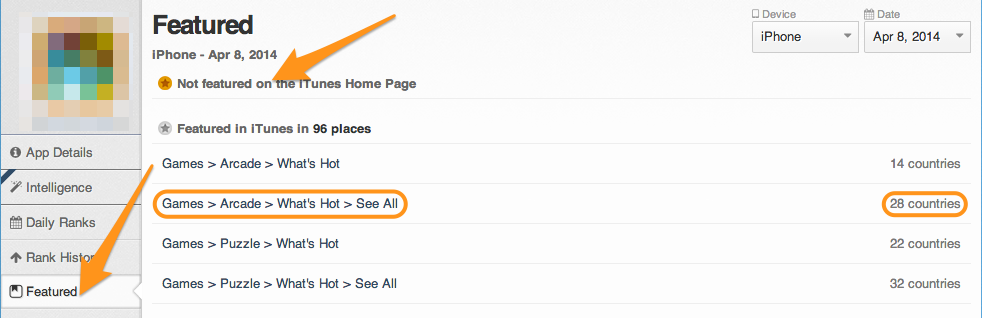
- Being featured by Apple, either in a specific category or overall
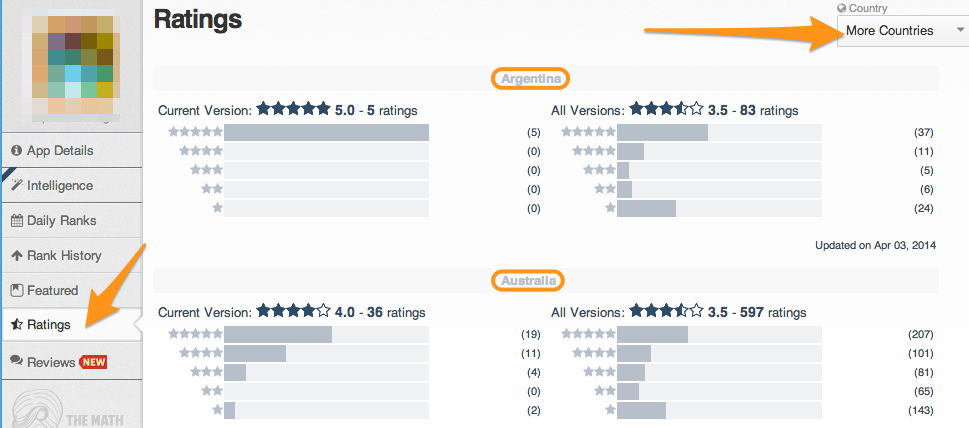
- A large number of four and five stars ratings from users
On the previous report, in neighboring tabs, you can find the app’s TOP positions aggregated across “all time.” This data consists of a specific category, the highest position the app reached and country it reached it in.
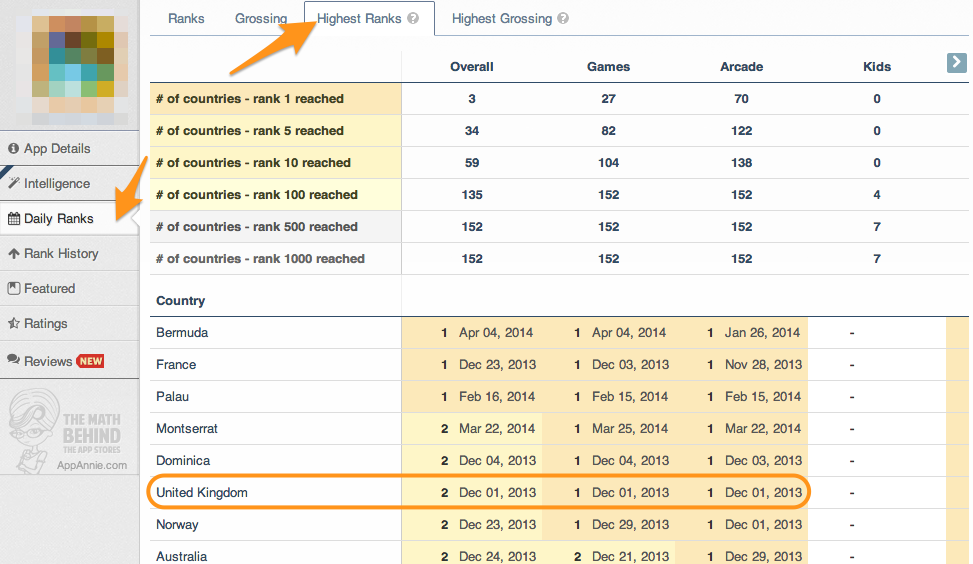
You can find out if an app was ever featured by Apple in this report shown in this screenshot:
You can find the data for an app’s rating/ranking country-by-country in this report in this screenshot:
What metrics should be analyzed to evaluate how profitable an app is?
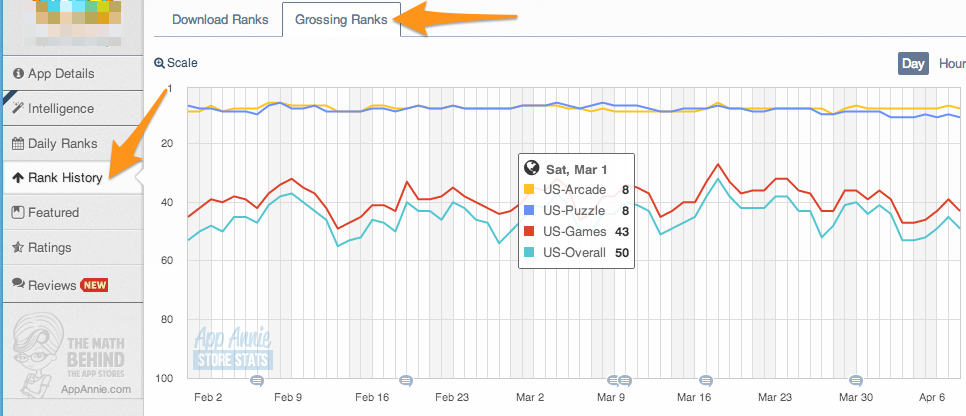
The only crucial metric you need to look at is the app’s position in the App Store Top Grossing chart. If an app hasn’t ever been listed in a Top Grossing category or the Top Grossing Overall chart, it should be an indication you might want to drop the app from consideration. Of course there is always a chance that an app might be monetized via banners ads. It’s quite easy to figure out if this is the case by launching the app and looking for third party banners inside. You can find the Top Grossing chart in the Rank History tab.
How do you find out how profitable the app has been or could be?
To us, profitability we mean the profit that app brings from a single user. The following method isn’t precise, but we use it for the lack of a better method.
Open the Store Stats report, choose country, device type and category. Analyze data from the Top Free and Top Grossing reports. The higher an app is on the Top Free chart, the more downloads it generates/more active user it has. While we don’t have user retention data, we can still use this particular chart data in the calculation. The higher app on the Top Grossing chart, the more profit it is currently returning
Let’s consider a situation when we have two apps. They are ranked 11 and 12 on the Top Free chart. One of them is ranked 20 on the Top Grossing and the other is ranked 140. By analyzing this data we can draw two conclusions: Both apps have equal amount of traffic. And, one app is generating way more profit than the other.
Look for apps that are ranked in the Top 25 Grossing and ranked low on the Top Free chart. This shows the app owners are managing to return decent profit with a low volume of traffic. These apps are the ones that have a great monetization model and are ones you should strongly consider investing in!
The much more common situation is that an app will rank pretty high on the Top Free chart, but low on the Top Grossing. Most likely such an app’s monetization model is based on a third party ad platform, without using in-app purchase mechanism or Apple’s iAd solution.
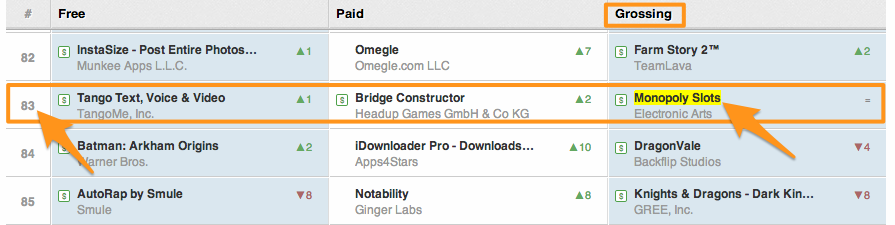
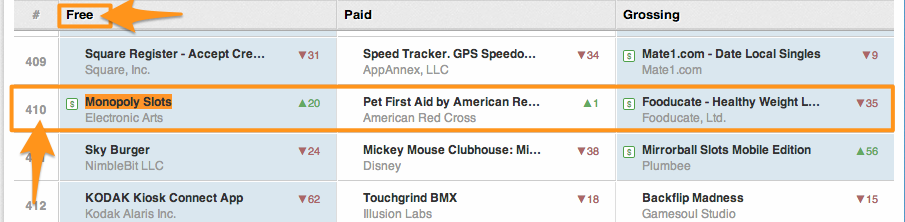
On these screenshots you can see where the Monopoly Slots game is ranking. The game is 83 on the Top Grossing iPhone US but only 410 on the Top Free chart. Such big gap between these positions is an indication that the game has a big active user base and it generates high profits.
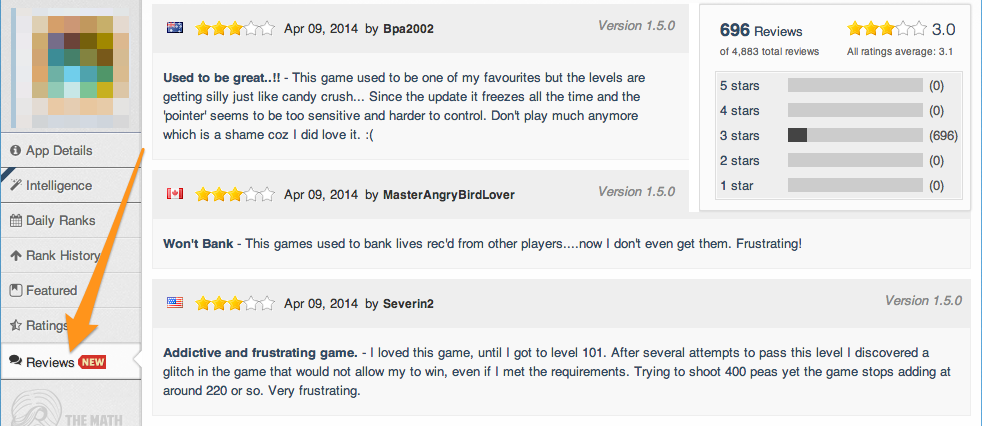
How can I reveal the app’s weak point without conducting in-depth research?
By looking at the Reviews tab, you can see all the customer feedback aggregated into one place, organized by country. Keep in mind, bad reviews are not necessarily a bad sign, as they can provide insight as to what the user experience pain points of the app are and where you can improve it with subsequent updates.
These are only a few ways of assessing an app’s true potential using App Annie. If you’ve got some questions about this topic, feel free to reach out to us at contact@comboapp.com and we’ll do our best to help you with answers/insight. Roman Kolos, Technical Director at ComboApp, contributed to this article.
This content is made possible by a guest author, or sponsor; it is not written by and does not necessarily reflect the views of App Developer Magazine's editorial staff.

Become a subscriber of App Developer Magazine for just $5.99 a month and take advantage of all these perks.
MEMBERS GET ACCESS TO
- - Exclusive content from leaders in the industry
- - Q&A articles from industry leaders
- - Tips and tricks from the most successful developers weekly
- - Monthly issues, including all 90+ back-issues since 2012
- - Event discounts and early-bird signups
- - Gain insight from top achievers in the app store
- - Learn what tools to use, what SDK's to use, and more
Subscribe here


Comments