Microsoft Azure Team Releases Application Insights Windows SDK 1.0.0
Wednesday, July 1, 2015

|
Stuart Parkerson |
The Microsoft Azure team has announced the release of Application Insights Windows SDK 1.0.0 which includes API changes to improve experiences and a number of stability and performance enhancing fixes.
The SDKs provide a set of automatic telemetry capture out of the box. Getting started with Application Insights is as simple as integrating the SDK into an application and rebuilding. Each platform specific SDK collects automatically the telemetry that is highest value for that platform.
Application Insights supports many of the application types used today, and is adding support for additional platforms. Current platforms supported include ASP.Net Web Applications, Windows Applications and Java Web Applications as well as Javascript based Web Pages, iOS, Mac OS X, Android, PHP, Python, Ruby and node.js.
Each SDK auto populates every telemetry item with a set of common context properties. By collecting them for every telemetry item, developers will be able to perform multi dimension slicing of any telemetry type in the Application Insights portal. In addition the SDKs collect correlation values, such as userID and sessionID, that enable correlation across different telemetry types. The list below represents some of the context properties automatically provided by the SDK. All of these values can be specified in code, when it is preferable to have more fine grained control over what is collected.
- Application Version
- Language
- Locale
- Model Name
- OEM Name
- Network Type
- OS Version
- Browser Version
- UserId
- SessionId
- OperationId
- Country or Region
All client SDKs collect basic usage telemetry automatically. This includes tracking of users and sessions in an anonymous manner. This basic telemetry can be critical to understanding if an application is succeeding and being used by customers.
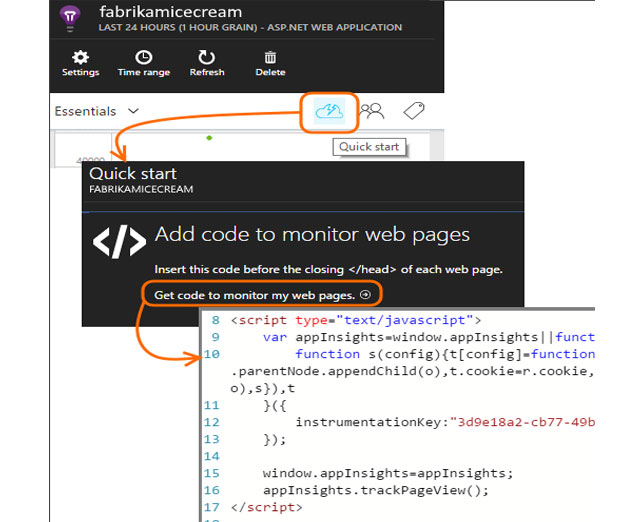
One of the significant changes in this latest version includes how the platform counts users and sessions. Until this release, the definition of a “Session” was a broad one – a session could be originated by a user or by another computing entity (e.g. another app calling a RESTful endpoint). This was confusing to many and could cause inflated metric values. Starting with SDK 1.0, Session in Application Insight means “User Session”. These are implications of this change:
- ASP.NET and Java Web SDKs no longer generate user and sessions cookies but rely on JavaScript SDK to provide these. To implement user and session tracking for web apps, instrumentation with JS SDK is now required.
- App instrumented with SDK 1.0, may report lower numbers of users and sessions, specifically for apps who had non-trivial volume of non-user originated calls
The SDKs also collects pageview telemetry automatically. For web applications, developers get traditional views into the popularity of pageviews and pageview performance. For mobile device apps, the SDKs collect pageviews representing the rending of UI views on each platform. This provides the ability to understand if users are engaging with an application and insight into what parts of an application are being used the most frequently.
To aid in diagnostics of difficult failure cases the AppInsights SDK collect telemetry relating to client app crash and server failures and exceptions. The SDKs are able to provide a significant amount of value in collection of this diagnostics information and provides deep insights into the failure modes of an app. For iOS crashes this includes symbolication support to convert machine code crash reports to readable stack traces. For server apps this allows for correlation of request failures to exceptions and dependency failures.
For server and service applications the Web and Java SDKs provide automatic telemetry collection of all incoming process requests and details of all outgoing dependency calls. This information is critical to understand the performance and operational characteristics of a server app. The SDKs provide a deep level of data collection, including information on duration and performance, status codes, and correlation to other telemetry data.
The Application Insights SDKs support the ability to collect machine performance counters from where an application is running. In addition to collecting basic performance counters like processor CPU and available memory, the SDKs support collection of any custom performance counter from a Windows machine. Collection of performance counters can provide significant insight into monitoring and diagnosing impact the application host environment is having on an application.
Application Insights SDKs allow the collection of trace (or log) telemetry. Developers can configure the SDKs to automatically capture telemetry from many of the existing popular trace logging frameworks available using including Log4Net, NLog, System.Diagnostics, LogBack, or Log4J. In addition to automatic collect developers can always log trace telemetry directly through the SDK API.
The SDK provide a simple and powerful API which allows for logging of any custom telemetry data. All automatic telemetry can be controlled, augmented, or replaced through the API. It also exposes two dedicated custom telemetry types, Events and Metrics, offering tools for collecting any telemetry data. Custom Events represent a single discrete instance of any tracked actions within an application. Custom Metrics support logging of time-series based data, through simple logging of data values, for the ability to extract average and sum metrics over time. In addition, like all telemetry, custom telemetry can be populated with properties, allowing for later multi dimensional analysis.
The Azure team suggests the best way to understand the value of Application Insights and the functionality provided by the SDKs is to add Application Insights to an existing application or try it out with a new prototype application. The getting started process should take no longer than 5 minutes. In addition, new applications are created as part of a free tier, allowing for a quick and no risk evaluation.
Read more: https://azure.microsoft.com/en-us/documentation/ar...

Become a subscriber of App Developer Magazine for just $5.99 a month and take advantage of all these perks.
MEMBERS GET ACCESS TO
- - Exclusive content from leaders in the industry
- - Q&A articles from industry leaders
- - Tips and tricks from the most successful developers weekly
- - Monthly issues, including all 90+ back-issues since 2012
- - Event discounts and early-bird signups
- - Gain insight from top achievers in the app store
- - Learn what tools to use, what SDK's to use, and more
Subscribe here
Azure, API, Telemetry Data, SDK, Metrics, Javascript, iOS, Android


_cptybzmh.jpg)


