

.jpg)
Optimizing your App Potential via Visual Mobile Analytics
Sunday, June 22, 2014

|
Alon Even |
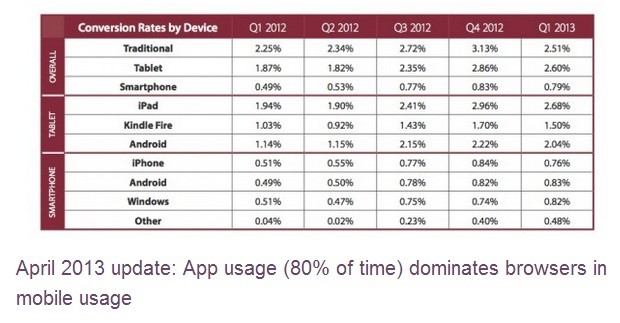
The world of mobile apps you may think is old news, but in many ways it is just getting started. As you may already know, the app world is flooded with some great apps, a few mediocre ones and lots of bad ones. Traffic to ecommerce sites from mobile devices is rising steadily, recently with web traffic from mobile surpassing that originating from PCs for the first time. However, mobile conversions are still lagging. It is for this reason that it becomes imperative to optimize mobile apps in order to reach that conversion pot of gold. Let's take a look at some numbers that tells the tale of which devices do a better job of converting and which platforms may need some help in optimizing the user experience.
So the question is how do you make yours stand out in the app crowd? Sure. Downloads are great, but does your audience continue using the app? Do they drop out after a few engagements, never to return? Do they get stuck on certain screens? How is your app's onboarding experience? What is your conversion rate? There are a lot of questions that need to be answered. There are also a lot of things you need to analyze in your mission to deliver an exceptional mobile user experience via solid UI.
Presenting the user with the most fluid and comfortable UX is imperative to bringing them on board. Everything from making your CTA (Call-to-Action) buttons just the right size and color to utilizing the most readable fonts and sizes as well as the use of aesthetically pleasing images. These elements all make for a memorable mobile experience, one that keeps visitors coming back and keeping them engaged.
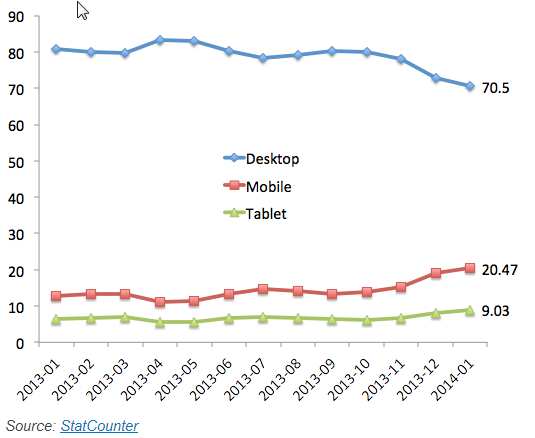
Below is another chart which shows that mobile devices now account for a whopping 30% of all commerce traffic.
Measuring is Everything
Those that measure and act upon the lessons they learn from those measurements will reap the most benefits. How does one do this? Via the use of visual mobile visual in-app analytics and features such as touch heatmapping, user recordings and visual reporting you will become empowered to measure, understand and optimize. Repeating the process is always necessary as you are always striving to reach the next level of optimization. If you had a 3% conversion rate on your CTA, why not go for 5% or higher.
Whether selling products, trying to increase downloads for your latest industry whitepaper or create buzz for your latest book by offering a few free chapters, the need to measure is tantamount to your app's success.
The core of the idea with visual mobile analytics is gaining insight into the behavior of your users and creating a sound optimization strategy. These are all insights you stand to gain via analytics, a much improved way of seeing data over the more traditional textual analytics that gives you a lot of numbers without the insights.
Utilizing the features at your disposal with a visual mobile analytics tool, you will be educated about the behavior of your users and why they do what they do when they do them. Challenges that app publishers face the world over such as dropoffs, poor user flow, low conversion rates can be remedied by digging deep into the User Experience and learning from it.
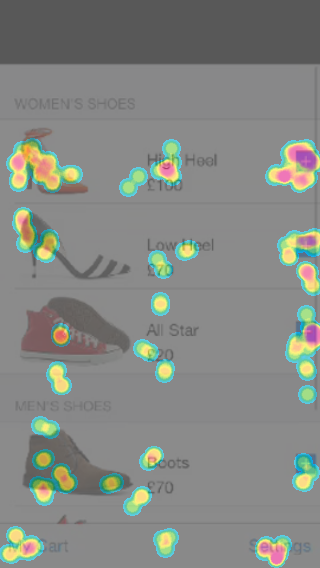
Touch Heatmaps
Heatmapping tools are highly effective in communicating your visitor's usage patterns when on any of your app's screens. Upon analysis of these patterns you can gain insight into the details of what part of your app's screen are being most utilized and also which are ones you may want to eliminate.
Say, you are suffering from dropoffs on the visitor's journey towards your checkout screen. You notice that your visitors are trying to click an image that they mistake for your CTA. This frustrates them and they just abandon their cart, probably never to return.
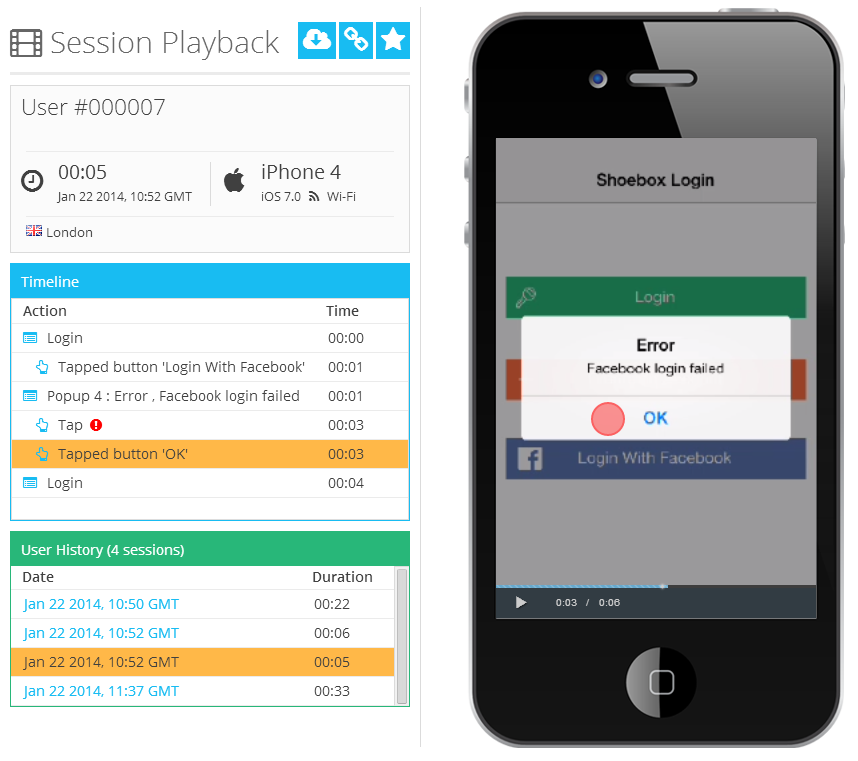
User recordings
By utilizing this feature, app publishers can follow the user's actions such as screen flow. You will see how the app is used through the user's eyes and will be able to identify friction points in the user experience. Recordings of your users track every swipe, tap and action within the app. Among other things, you will be able to see why users abandon your app, at what step your app crashed, and detailed user interaction. This recording feature is transparent to the user and in no way disrupts the user experience or performance of the app itself.
Realtime Visual Analytics
By utilizing graphical real-time reports you will gain pinpoint insights into the behavior of your users, how you can optimize your app and identify opportunities to increase conversion rates and increases in ROI. You will gain a granular perspective of such things as where users are spending the most time within the app, which screens suffer from a high quit rate, and what screens pose a problem and have a confusing UI.
Optimizing Beyond Analytics
What content you serve up to your visitors is another way of optimizing in concert with analytics. What and how much contact information you should disclose is also something you need to decide on. What images would best connect your brand with the customer. These are things you need to research as every audience is different and reacts differently to different types of content.
Global coffee chain Starbucks optimizes the user experience by allowing customers to order before they reach the store for easy pickup. To encourage use of this feature, they offer their customers awards that translate into free drinks. The company is also extending this feature to food, as it takes longer to prepare and can further ease the lines. These are things you can do to optimize the user experience and increase customer loyalty, in addition to using mobile analytics.
Utilizing visual mobile analytics is an indispensable tool that empowers you to not only see how users are using your app, but also why they take certain actions. Studying this and taking action by planning your optimization strategy is paramount to your success.
This content is made possible by a guest author, or sponsor; it is not written by and does not necessarily reflect the views of App Developer Magazine's editorial staff.

Become a subscriber of App Developer Magazine for just $5.99 a month and take advantage of all these perks.
MEMBERS GET ACCESS TO
- - Exclusive content from leaders in the industry
- - Q&A articles from industry leaders
- - Tips and tricks from the most successful developers weekly
- - Monthly issues, including all 90+ back-issues since 2012
- - Event discounts and early-bird signups
- - Gain insight from top achievers in the app store
- - Learn what tools to use, what SDK's to use, and more
Subscribe here


