Developing a Functional Reporting Framework for Software Testing
Thursday, August 27, 2015

|
Don Vilsack |
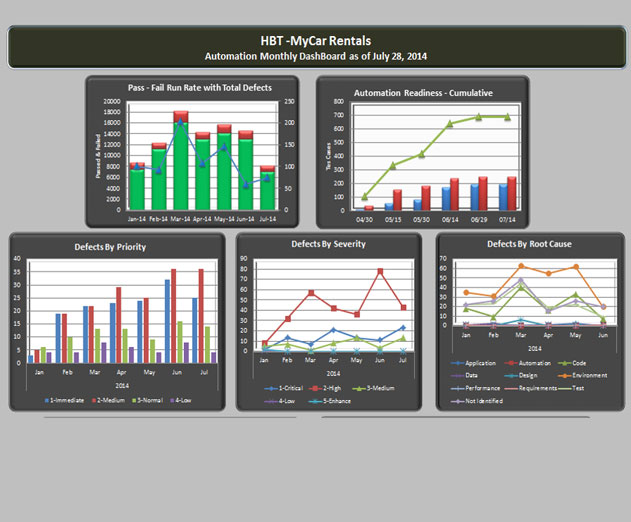
In software development and testing, an important element for continual improvement is proactive, repetitive measurement of key metrics, documented through well-designed and executed reports that enable organizations to effect positive change. Yet, many organizations either struggle to identify the most meaningful metrics and KPIs (key performance indicators), or they are unable to organize them into an actionable reporting system.
The processes of software testing - from requirements development to test planning and on to test execution and defect management - leave a trail of data “bread crumbs.” When firms extract and organize this data into contextually significant reports that are consistently useful to all team members, the resulting information promotes informed decisions that reduce costs, accelerate release cycles, and improve quality.
No matter where an enterprise stands in terms of data extraction and reporting, their systems almost always have room for improvement.
Establishing Where You Are
Identifying and transforming metrics into actionable information is a process that flows across a continuum of stages, from what Orasi terms “chaotic” to “predictive.” Before any organization can begin effectively harvesting and meaningfully organizing and taking action on data, they should determine where they are on that continuum. (Some haven’t reached the most basic level, at all.)
Level 1: Chaotic
At this fundamental level, individuals create reports (usually manually, potentially with basic tools), to suit their particular needs. Data gathering, metrics and report standardization across projects is extremely unlikely.
Level 2: Sporadic
Here, individuals create reports (manually with the use of basic tools, or through limited automation) to suit the needs of local teams. As standard data values and metrics are identified across the tools, some reporting standardization becomes possible.
Level 3: Reactive
The use of standardized tools, data values, metrics, and workflows enables automated generation of uniform, domain-specific reports that functional leaders can use to share information with project stakeholders. However, informed decision making and improvement based on the information is still largely absent.
Level 4: Proactive
Project leadership makes informed use of reports developed from well-defined, readily available metrics and KPIs, interpreting and relying on them to monitor project statuses, prioritize efforts, and identify and manage risk. Here, the organization is reaping solid value from reporting, but it is not achieving the enterprise-wide visibility and ongoing improvement through historical analysis and feedback loops that fully optimizes results.
Level 5: Predictive
The organization has achieved standardization of data extraction, transformation and loading (ETL), as well as report standardization, across all initiatives and projects. Teams follow a disciplined approach of not only leveraging but also continuously refining KPIs. Historical data drives forecasting, with trending and analytics providing richer insights. The entire enterprise consumes socialized KPIs, gaining fact-based confidence and taking data-driven action, improving project efficiency and outcomes.
In our experience, a large percentage of firms fall into one of the first three categories. Those that make it to the Reactive or even the Proactive stage frequently and inaccurately believe they have gained sufficient value from data and stop their efforts there. The ones that recognize there is additional benefit to be gained are often uncertain how to achieve it.
Defining What to Measure
If your firm is still in the early stages of our continuum - or reporting isn’t happening at any level - you may not even be aware of the right metrics and KPIs. A sampling of some of the many key test execution and defect management metrics and KPIs that we encourage our customers to extract and transform into actionable information include:
Planned Test Execution vs. Actual Test Execution
- Total number of tests to run.
- Number of tests that passed, failed, and were blocked that day.
- Number and percentage of tests that remain to be run.
- Ratio of Pass tests to total number of tests; Failed tests to total number of tests.
- Ratio of total Pass tests to total number of Failed tests.
- Ratio of total Failed tests to total number of Blocked tests.
Defect Status
- Total number of open or closed defects to date and for the current day.
- Total number of defects in any combination of the following: severity, priority, days open, reopen rate, team, or by individual.
- Defect distribution by any of the following: severity, status, or root cause.
- Trending of defects: are we opening more defects than we are closing?
- Trending of defects: is the severity of defects moving in a positive or negative direction?
Test Case Effectiveness
- Number of defects not mapped to test cases compared to number of defects mapped to test cases.
- Number of defects not mapped to requirements compared to number of defects mapped to requirements.
Traceability/Code Coverage
- Percentage of test cases that map directly to requirements.
In addition to these metrics, organizations must establish baselines for KPIs. Logical baselines for these four categories might be:
- For Planned versus Actual Execution: Eight percent deviation from plan.
- For Defect Removal Efficiency: 90 percent of defects removed.
- For Test Case Effectiveness: 10 percent not mapped.
- For Traceability/Code Coverage: 98 percent
Every organization and project is unique and there are many other metrics and KPIs, plus achievable baselines and benchmarks, that can be utilized. The more useful metrics that an organization incorporates into its reporting, the more insight it will achieve into the project’s success or failure. However, it is better to develop a reporting framework with 10 correctly identified and extracted metrics, organized into actionable reports, than to haphazardly gather and ineffectively organize 50 metrics with little to no insight gained.
Exploring How to Achieve It
A properly developed and executed reporting framework should empower team members and leaders with data-driven insights, enabling them to monitor the progress and improve the effectiveness of test case development, test planning and execution, defect removal, and other testing processes.
Additionally, it cannot be static. The underlying solution should be able not only to fully utilize historical data for trending comparisons but also be flexible enough to adapt to new data sources and queries, as appropriate, as projects arise and programs evolve. All of this input should populate across the entire testing ecosystem, automatically, without the need for additional customization.
A successful program must also achieve broad user acceptance, which generally requires more than simply harvesting the right metrics and spitting out pre-programmed reports. In addition to printable reports, organizations should develop—with the advance input of stakeholders—user-friendly, easily digestible data formats such as dashboards and scorecards.
Achieving such a framework is a fairly complex process, even when automation tools are already present but not effectively used. At Orasi, we have identified six phases that provide the clarity and scope to produce a desirable outcome. Anything less will likely involve shortcuts that reduce value and potentially result in user rejection.
Phase 1 - Planning: Clarify and identify metrics and KPIs to be reported.
Phase 2 - Design and Build: Develop specified data extracts, metrics, templates, and reports.
Phase 3 - Test and Validate: Verify the automated solution against production systems.
Phase 4 - Stakeholder Review: Demo the solution in a production environment, and validate its functionality.
Phase 5 - Documentation: Produce user documentation and conduct knowledge transfer of the reporting solution.
Phase 6 - Deployment: Orchestrate initial implementation and provide subsequent support.
Despite the complexity and extent of such a project, when properly orchestrated, the effort is proven to offer considerable rewards. Additionally, teams are more satisfied and productive in a consistent environment.
Case Example: A Large Financial/Investment Institution Sees Extraordinary Results
Orasi worked on a project that perfectly illustrates the value to be gained from developing a unified, advanced reporting framework such as we have described here. A large financial firm had previously contracted with us to provide offsite testers. They were merely one component of a very large testing team working on numerous testing initiatives - programs, as they are called in the industry.
After I personally observed several process inefficiencies, we suggested that they consider moving to a more advanced level of data ETL and reporting. Our initial calculations indicated that not only would the improvement help assure quality across all initiatives and projects; it could also save the organization an exponential number of man hours.
Previously, project teams in the organization had been ineffectively using both manual and simple data extractions for data gathering. The teams were also creating disparate, inconsistent metrics and using unrelated report formats including Word, Excel, SharePoint and email.
Using our recommendations and processes to resolve these challenges, the Orasi team helped them implement a functional framework for data ETL, incorporating a carefully targeted group of metrics backed by robust reporting. After the engagement was complete, the firm’s project teams were able to generate three times more content than they had previously - in less than 10 percent of the time.
While achieving far greater, more actionable insight, the organization reduced man-hour expenditure for data extraction alone from in excess of 10,000 hours to fewer than 1,000 hours, per calendar year. They have also facilitated much greater management and control for the executive team and eliminated inconsistent, inaccurate results across all the initiatives and their numerous projects.
Make It Happen
Starting such an effort can be daunting, which is why organizations often hire consultants to plan and potentially orchestrate the effort. Firms experienced with developing reporting frameworks often bring added value, such as industry best practices, pre-defined templates, data queries, and other components to the project.
Factors that generally drive enterprises to seek a better reporting framework are varied. They may suffer from a lack of data consistency and reliability, or they may find that data extraction and report development is simply too complex. Others are tired of wasting precious resources on the man hours required for extensive manual reporting.
In every instance I have witnessed, these organizations learn that no matter what they hoped to gain from developing an advanced, functional reporting framework, they invariably achieve more than they planned. Thanks to powerful, automated data extraction and analysis tools - and proven methodologies for developing, deploying, and continually improving test reporting frameworks, the power of organizations to control and improve testing results through advanced data insight and informed action is nearly limitless.
Read more: http://www.orasi.com/Pages/default.aspx
This content is made possible by a guest author, or sponsor; it is not written by and does not necessarily reflect the views of App Developer Magazine's editorial staff.

Become a subscriber of App Developer Magazine for just $5.99 a month and take advantage of all these perks.
MEMBERS GET ACCESS TO
- - Exclusive content from leaders in the industry
- - Q&A articles from industry leaders
- - Tips and tricks from the most successful developers weekly
- - Monthly issues, including all 90+ back-issues since 2012
- - Event discounts and early-bird signups
- - Gain insight from top achievers in the app store
- - Learn what tools to use, what SDK's to use, and more
Subscribe here

